 五度妙笔
五度妙笔 企业透视镜
企业透视镜 API商城
API商城
 数据库
数据库技术前沿:研究用于复杂纳米塑料混合物的全光 Mie 空隙传感器

纳米塑料的检测难点,在于颗粒很小,却需要同时回答“是什么材料、具有何种形状、尺寸有多大”等问题。电子显微镜能够观察颗粒形貌,但外观相近的聚合物难以仅凭图像区分;红外和拉曼光谱可提供分子指纹信息,其纳米尺度分析仍受到空间分辨率、信号强度及测试条件等限制。因此,能够把颗粒形态与材料差异转化为直观光学信号的检测方法,具有研究价值。斯图加特大学与拜罗伊特大学研究团队在 Nature Communications 报道了全光 Mie 空隙传感平台。研究者将纳米空隙阵列制备在高折射率基底中,利用几何匹配捕获颗粒,再通过空隙共振颜色变化读取信息。在模型混合体系中,该平台区分了不同聚合物及不同形状的颗粒,将既有的球形聚苯乙烯检测拓展到更复杂的组合。
创新点
1.将颗粒分选与光学读出集成在同一纳米结构中。空隙根据尺寸和形状优先保留匹配颗粒,同时将填充状态转化为可由光学显微镜记录的共振颜色。
2.利用折射率差异区分外观相近的聚合物颗粒。结合单组分参照和颜色分析,实现对 PS、PMMA 及 PET 颗粒样品的材料敏感识别。
3.将形状识别拓展到不同长宽比。圆形与椭圆形空隙可分选球形和椭球形颗粒,匹配设计进一步区分约 2∶1、3∶1 和 4∶1 的椭球形 PS。
4.通过偏振差分成像增强颜色对比。在所测椭圆空隙体系中,未填充与已填充空隙的 CIE 色度坐标间距由无偏振时的 0.070 提高至 0.36,约为原来的 5.1 倍。
研究内容
1、纳米空隙如何同时完成捕获与光学读出
传感器以砷化镓(GaAs)为基底,通过电子束光刻和等离子体刻蚀形成圆形或椭圆形纳米空隙。不同几何尺寸的空隙构成规则阵列,既为颗粒提供容纳位置,也支持局域 Mie 共振。空隙中填入颗粒后,局部有效折射率及颗粒与光场的重叠发生变化,引起共振光谱和反射颜色改变。
实验中,研究者先通过氧等离子体处理提高表面亲水性,再滴加颗粒分散液,待其完全干燥后进行水中超声清洗。与空隙尺寸、形状匹配的颗粒具有更强的相互作用,更易保留;匹配较差或松散附着的颗粒则被优先移除。因此,最终分选结果由几何匹配和清洗过程共同决定。
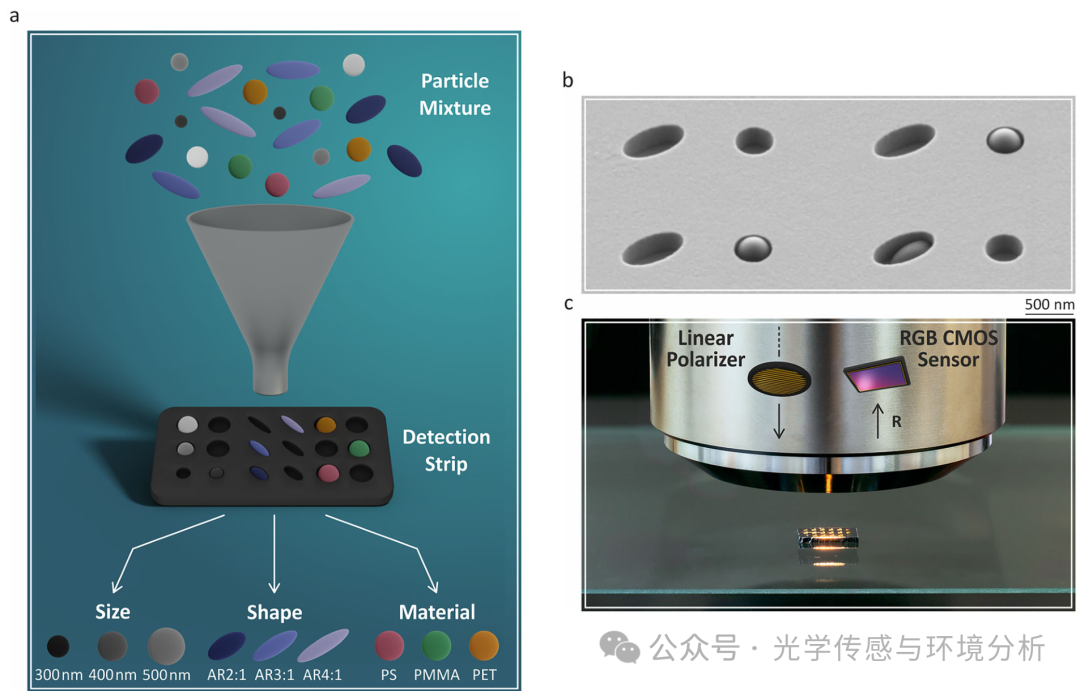
Fig. 1 Sensor principle. a Schematic illustration of the measurement principle. A mixture of spherical particles of different sizes or different materials, as well as ellip soidal particles with varying aspect ratios (ARs), is analyzed. The detection strip, con sisting of void arrays, is fabricated in gallium arsenide substrates and enables material and shape-sensitive particle detection. b SEM image of voids presenting trapped round and ellipsoidal particles. c Photograph of the measurement setup. A linear polarizer combined with a standard microscope objective is used to image the detection strips. The linear polarizer (left) and the RGB CMOS sensor (right) are indicated schematically
颜色读出采用反射明场光学显微镜与 CMOS 相机,必要时在光路中加入偏振片。图像分析程序识别周期排列的空隙,提取各空隙区域的平均 RGB 值,并映射到 RGB 或 CIE 色空间。“全光”描述的是信息读出方式;器件制备、样品沉积和清洗仍是实验流程的组成部分。
2、通过共振颜色区分外观相近的聚合物
研究者首先将标称直径均为 300 nm 的聚苯乙烯(PS)与聚甲基丙烯酸甲酯(PMMA)混合。两类颗粒在 SEM 图像中的外观接近,但在 633 nm 处的文献折射率分别约为 1.59 和 1.49,为材料敏感读出提供了光学差异。所用圆形空隙直径约 410 nm、深约 310 nm,中心间距为 1.2 μm。
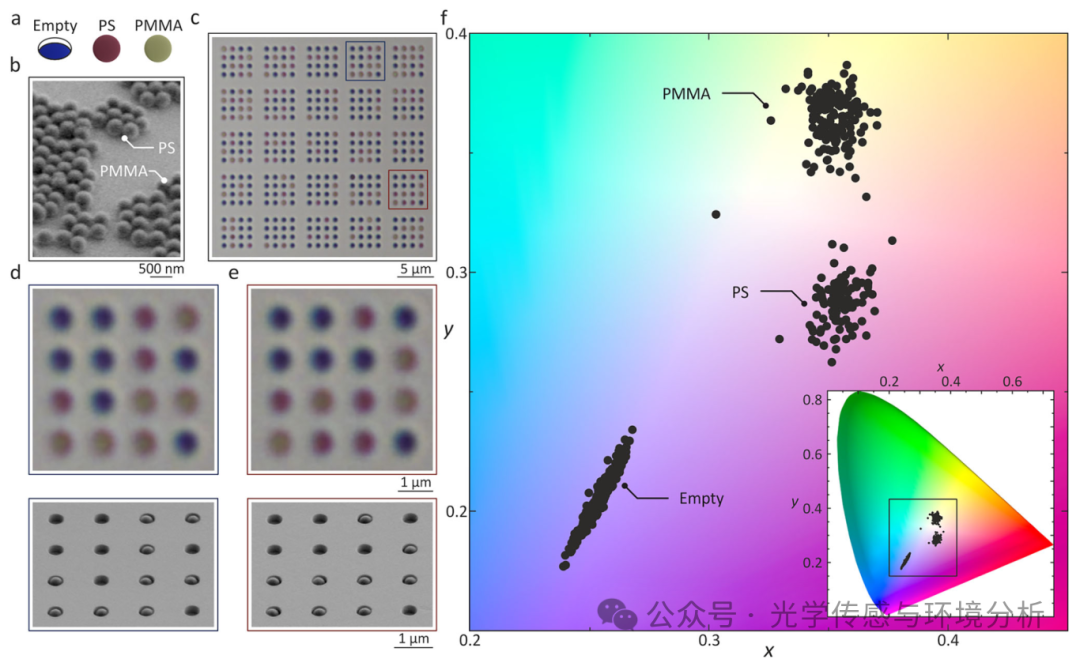
Fig. 2 Distinguishing different nanoplastic materials. a Different polymer nanoparticles (PS and PMMA) with similar diameters of about 300 nm can be distinguished by their characteristic Mie void colors. b SEM image of the particle mixture deposited onto the Mie void sample. c Optical microscope image of the void array, consisting of 5 ×5 fields, each containing 16 voids. Empty voids remain blue, while the filled voids become red (PS) or orange (PMMA). d, e, Magnified microscope and SEM views of two distinct fields, highlighting the material dependent color contrast.f Color representation of the detected void colors across the entire detection strip. (Inset) Full CIE-1931 color diagram
在这组空隙和成像条件下,未填充空隙呈蓝色,PS 填充后呈红色,PMMA 填充后呈橙黄色。超过600个空隙的颜色数据在 CIE-1931 色度图中形成三个分离簇;单独加入 PS 或 PMMA 的参照实验支持了颜色归属。这说明在结构与采集条件受控时,可通过共振颜色区分形貌相近的颗粒。
这里的“300 nm”是颗粒标称尺寸。DLS 测得 PS 和 PMMA 的平均粒径分别为 363 nm 和 374 nm,提示实际尺寸分布也会影响颜色。图中还存在一个由污物部分占据空隙引起的离群点,其归属经 SEM 核对。材料判别因而需要参照校准,并结合填充状态理解异常颜色。
3、用不同形状的空隙分选球形与椭球形颗粒
为单独考察形状因素,研究者使用同为 PS 的球形颗粒和长宽比约 2∶1 的椭球形颗粒。圆形空隙直径约 400 nm,椭圆形空隙长轴和短轴分别约 600 nm、300 nm。沉积并清洗后,球形颗粒主要保留在圆形空隙,椭球形颗粒优先保留在椭圆形空隙。
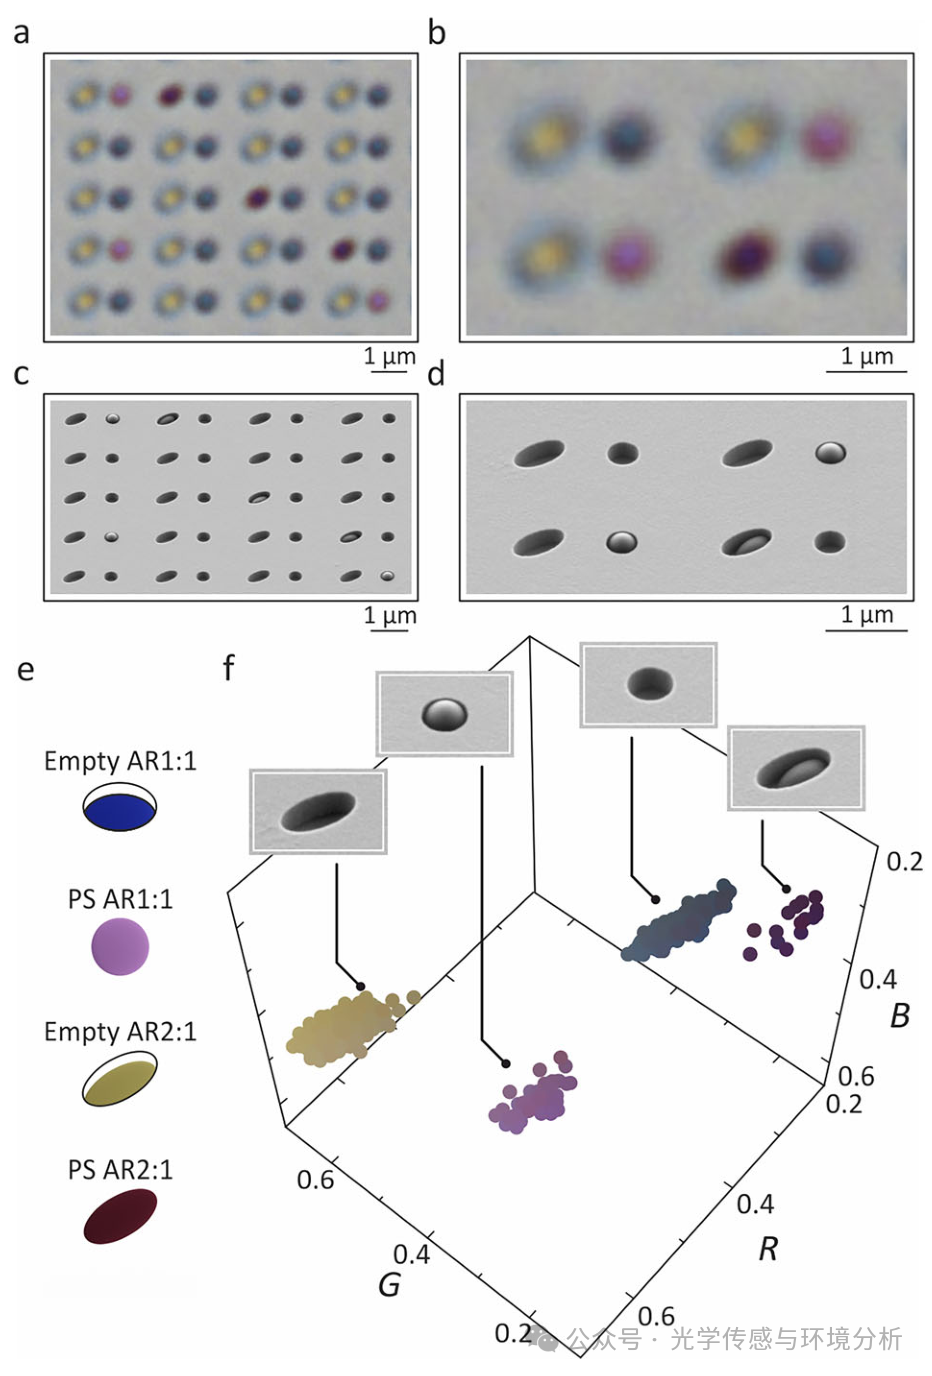
Fig. 3 Shape-selective nanoparticle sorting. a, b Optical microscope and c, d SEM images of the detection strip with elliptical (left rows) and round (right rows) voids. Ellipsoidal particles are trapped only in elliptical voids, while spherical particles (350 nm diameter) only occupy round voids. Linear polarization along the short axis of the elliptical voids is utilized for image capturing. e Colors of the empty round and elliptical voids and the deposited mixture of round PS particles and ellipsoidal PS particles with an aspect ratio of 2:1. f RGB color mapping reveals four distinct clusters: empty round (blue), filled round (pink), empty elliptical (yellow), and filled elliptical (dark red). SEM images around the RGB cube illustrate each void state.
图3中空圆孔、填充圆孔、空椭圆孔及填充椭圆孔在 RGB 空间中形成四个分离簇。同一组颜色换成 CIE 表示时却难以充分区分,说明应依据具体数据选择色空间。研究者还在7500个圆孔中发现11例椭球形颗粒尖端插入的误捕获,比例约0.15%;这只是该条件下的误捕获比例,不能等同于方法的总体分类准确率。
4、匹配长宽比进一步细分椭球形颗粒
研究者在同一检测条上同时加入长宽比约为 2∶1、3∶1 和 4∶1 的三组椭球形 PS,并设计对应的椭圆空隙。三组颗粒实测长宽比分别为 2.02(±0.16)∶1、2.85(±0.20)∶1 和 3.74(±0.23)∶1。匹配空隙的长轴×短轴尺寸分别约为 620×340 nm、800×310 nm 和 960×290 nm。
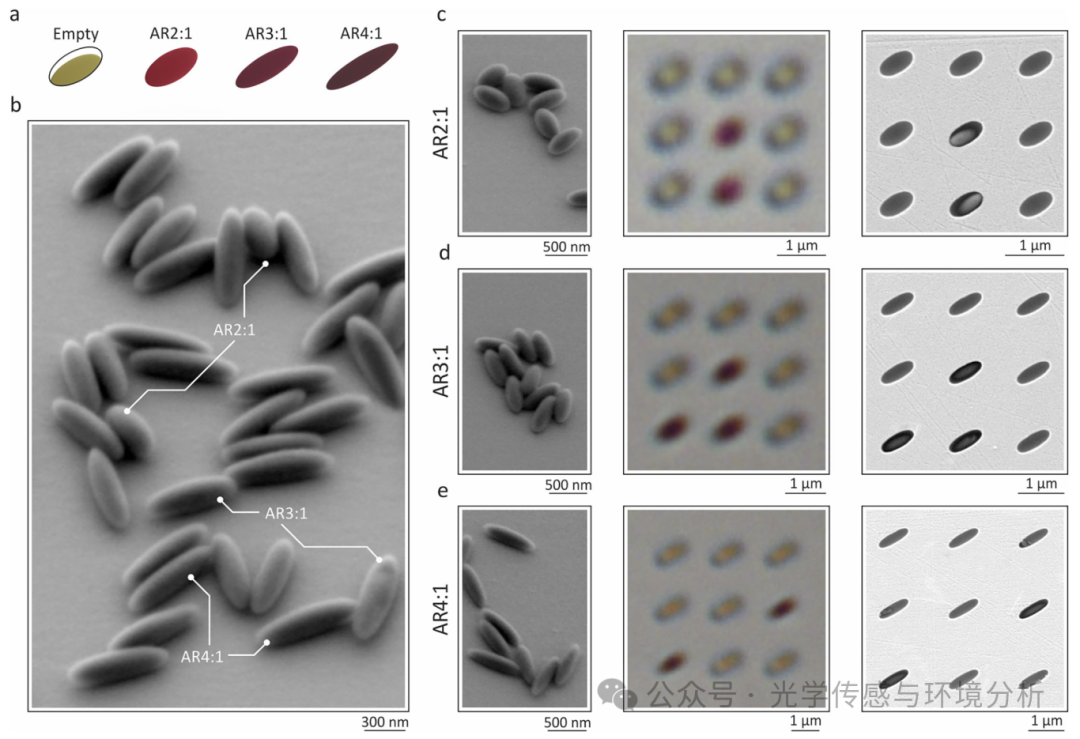
Fig. 4 Ellipsoidal nanoparticles with different aspect ratios. a Deposited mixture of ellipsoidal particles with three different aspect ratios. b SEM image of the utilized mixture. c–e Ellipsoidal particles with aspect ratios of 2:1, 3:1, and 4:1 are used: (left) SEM image of the individual particle types, (middle) optical microscope images under linear polarization along the short axis of the void, and (right) SEM images depicting the filled and empty voids.
清洗后,匹配颗粒填充的空隙呈明显红色,未填充空隙呈黄色调,光学结果与SEM图像相互印证。不同几何阵列由此把相同材料的颗粒进一步按长宽比分组,说明平台的形状识别不局限于“球形或非球形”的二分判断。
几何选择性仍存在少量例外:原文观察到约 3∶1 的颗粒残留在为 2∶1 颗粒设计的空隙中。其颜色比正确填充时更浅,可作为异常匹配的判断线索。因而,阵列位置与共振颜色应共同参与解读。
5、用偏振差分增强较弱的颜色差异
椭圆空隙沿长轴和短轴对光的响应不同。旋转入射偏振方向,可以改变未填充空隙与填充空隙之间的颜色差异。研究者选取含6个未填充空隙、3个已填充空隙的区域,以两组平均 CIE 色度坐标之间的欧氏距离衡量颜色对比。该数值是文中定义的色度坐标间距。
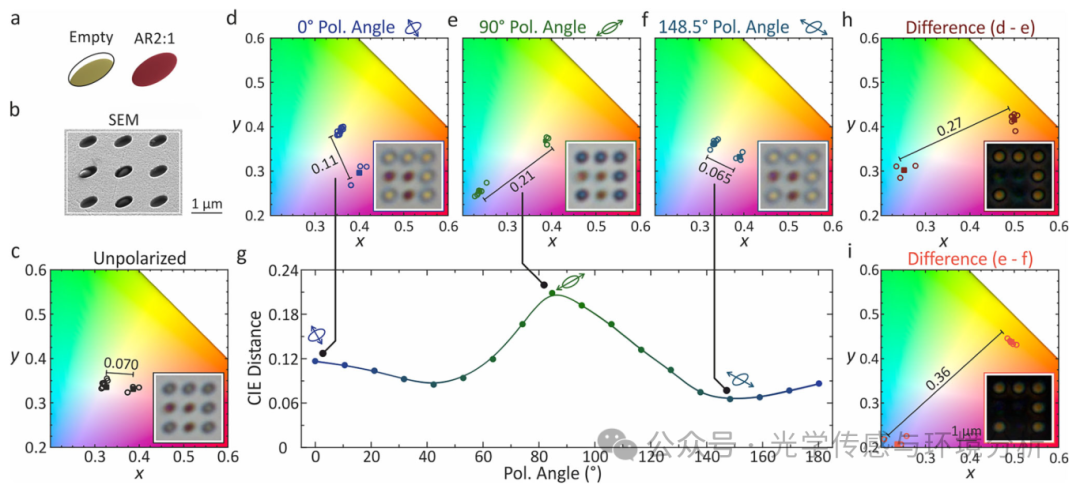
Fig. 5 Polarization-dependent color contrast enhancement. Detection of ellipsoidal particles is optimized through polarization-sensitive imaging and differential analysis of different polarization states. a The deposited ellipsoidal particles have an aspect ratio of 2:1. b SEM image of the examined detection field containing three filled voids. c–f Four different polarization states are examined. In the CIE-1931 diagrams, represented by the x and y values, the color of the six empty and the three filled voids is displayed (circles). The average color values (squares) reveal that the color separation depends on the polarization angle. The reported values correspond to the distance between the mean color coordinates. g CIE distance as a function of polarizer angle, showing a maximum color separation for polarization aligned with the long axis of the void and a minimum separation at a polarization angle of 148.5 °. h, i Differential images obtained from images d and e, and from images e and f, respectively. The increased distance values demonstrate that differential imaging can enhance the color contrast between empty and filled voids. (Insets) Optical microscope images used for the analysis.
无偏振条件下,色度间距为 0.070;偏振分别沿短轴和长轴时,数值提高到 0.11 和 0.21;在148.5°时则降至 0.065。研究者进一步对两幅图像的每个 RGB 通道取绝对差:正交偏振图像的差分使间距达到 0.27,而长轴偏振与148.5°偏振图像的差分将其提高至 0.36。
0.36约为0.070的5.1倍,反映的是本实验的颜色对比增强。差分图中,偏振响应弱的背景被压低,未填充空隙与填充空隙更易区分。这里没有对应的浓度检出限或检测灵敏度提升倍数,不能据此宣称检测限降低5.1倍。
此外,原文还通过交叉偏振成像探索颗粒在空隙内的相对位置。不同位置产生不同的空间颜色分布,说明偏振信息还可帮助分析填充构型,为判读不理想的捕获状态提供补充。
6、在同一混合物中同时读取形状和材料信息
综合验证实验同时加入长宽比约 2∶1 的椭球形 PS,以及标称直径300 nm的球形 PS、PMMA 和聚对苯二甲酸乙二醇酯(PET)颗粒样品。检测条包含圆形和椭圆形两类空隙,图示区域由5×20个检测单元组成,每个单元各含4个圆形空隙和4个椭圆形空隙。
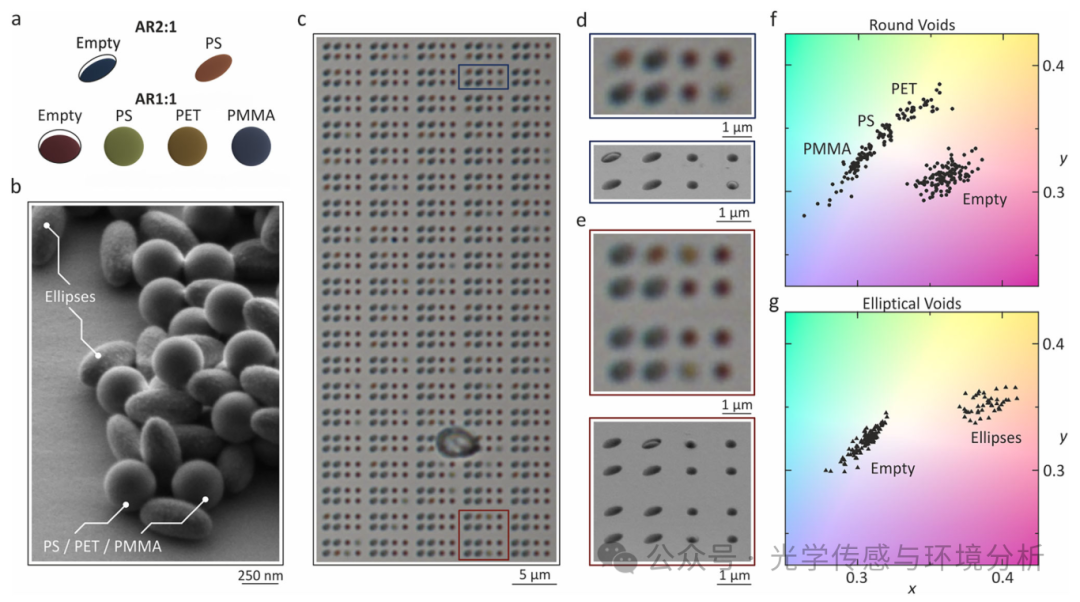
Fig. 6 Crossed-polarizer analysis. Particle positions within individual voids are analyzed using two crossed linear polarizers. a Optical microscope image acquired under crossed-polarizer illumination. b Corresponding SEM image indicating the different particle positions within the voids. c Magnified views of four distinct voids. The colored frames indicate the corresponding voids in the optical and SEM image. Comparison of the voids marked by the white, pink, and blue frames shows that the optical microscope image already provides information about the particle position. In addition, no clear difference is observed between the voids marked by the blue and green frames due to the same particle position within the void.
圆形空隙的颜色在 CIE 图中形成四个簇,对应未填充空隙以及 PS、PMMA、PET 样品填充状态;椭圆形空隙则区分空与椭球形 PS 填充两类。两类空隙需要分别分析,因为空椭圆孔与 PMMA 填充圆孔的颜色可能相近。该实验的判别依据是已知空隙几何类型下的颜色响应,不能简单合并为六类通用颜色标签。
PET 样品还有一项需要保留的实验条件:其由 PS 球作为种子制备,PET 含量至少为75%,并非纯 PET 颗粒。PS 内核会影响有效折射率。该结果支持平台对这组颗粒样品的区分能力,但推广到未知聚合物或真实老化颗粒时,仍需重新建立参照。
研究结论
该文将高折射率基底中的 Mie 空隙设计为兼具几何分选与光学读出功能的传感单元,在模型体系中实现了约300 nm标称尺寸球形颗粒的材料敏感检测,以及球形、椭球形和不同长宽比颗粒的形状区分。通过空隙几何匹配、共振颜色分析和偏振差分,平台在同一混合实验中获取了材料与形态两方面的信息。
这项工作的价值在于,把原本难以从普通显微图像中直接获得的颗粒差异,转换为空隙阵列上的可分析颜色。其读出端采用常规光学显微镜和图像分析,捕获后的颗粒也保持可接近状态,可为后续更高化学特异性的分析提供条件。它为纳米塑料光学筛查增加了一种可与光谱方法互补的技术路径。
现阶段的结论仍应限定在文中验证范围内。研究使用了人工制备或商业模型颗粒,尚未完成真实环境水样或血液等复杂基质的系统验证;颜色也受空隙几何、粒径分布、填充位置及白平衡影响。后续需要考察真实样品中的回收率、基质干扰、材料判别可靠性和浓度定量能力,才能进一步评估其作为现场检测条的适用性。
文章题目:All-optical Mie void sensor for complex nanoplastic mixtures
DOI:10.1038/s41467-026-76199-8
星标的内容=你在乎的内容,根据微信公众号推荐原则,没有在传感器专家网公众号主页【设为星标】,将无法及时获得传感器行业最新资讯!
来源:光学传感与环境分析
声明:本文内容系作者个人观点,不代表传感器专家网观点或立场,有疑问请联系:pengzhenlie(微信号)。