 五度妙笔
五度妙笔 API商城
API商城
 数据库
数据库Evolutionary dynamics of insect odorant receptors reveal ecological tuning shaping olfactory perception
Abstract
Insect olfaction is facilitated by a heterotetrameric odorant receptor–odorant receptor co-receptor (OR-Orco) complex, which is distinct from that of vertebrate ORs. However, extreme sequence divergence among insect ORs has hindered a unified understanding of their evolutionary history and ecological importance. In this study, we present a multiscale analysis of OR genes across 115 insect species. We overcome the limitations of traditional phylogenetic approaches by applying a protein similarity network-based strategy and introduce a "trunk–branch" framework to systematically describe the evolutionary trajectories of insect ORs across sequence, structural, and functional levels. Although they possess different sequences and structural communities, all the insect orders were found to contain fully functional OR repertoires. Notably, insects adapted to end-Permian mass extinction through shifts in their functional OR repertoires, and early- and late-diverging lineages exhibit distinct patterns of OR differentiation. The emergence of Orco represents a key evolutionary transition point, marking the shift from a homomeric to a heteromeric complex accompanied by specialization of the extracellular domain and binding pocket. Furthermore, we established robust associations between olfactory recognition breadth and ecological variables, including diet, circadian rhythm, and habitat. Our findings provide a comprehensive framework for the evolution of insect ORs, explaining the complex adaptive relationship between insect olfactory potential and diverse ecological environments.
Introduction
Olfactory systems play a critical role in animal survival strategies, governing critical behaviors from nutrient acquisition to mate selection (
Bargmann 2006
;
Nei et al. 2008
;
Kaupp 2010
). Within the kingdom Animalia, insects—the most speciose metazoan group—have evolved exceptionally sophisticated chemosensory systems to interpret complex volatile landscapes (
Nei et al. 2008
;
Kaupp 2010
;
Mora et al. 2011
;
Robertson 2019
). The extraordinary sensitivity of insect olfaction to hydrophobic volatile organic compounds (VOCs) is facilitated by a heterotetrameric channel complex consisting of odorant receptors (ORs) and odorant receptor co-receptors (Orco) (
Clyne et al. 1999
;
Vosshall et al. 1999
;
Sato et al. 2008
). Insect ORs represent a distinct protein superfamily that originated independently of vertebrate ORs, with no shared homology between the two (
Sato et al. 2008
;
Hansson and Stensmyr 2011
). Studies have shown that this ancient structural fold has a deeper phylogenetic origin (
Benton and Himmel 2023
;
Himmel et al. 2023
). While vertebrate ORs have been extensively studied (
Niimura and Nei 2005
;
Hughes et al. 2018
;
Pacalon et al. 2023
;
Policarpo et al. 2024
), the extremely low sequence similarity among insect ORs has made resolving their internal sequence, structural, and functional differences challenging (
Robertson and Wanner 2006
). Extensive studies have reported advances in the olfactory recognition mechanism and OR function (
Guo et al. 2021
;
Chang et al. 2023
;
Depetris-Chauvin et al. 2023
;
Jiang et al. 2024
), which have greatly facilitated a deeper understanding of insect olfactory perception. However, a comprehensive integrative analysis of OR sequences, structures, and functions across the entire class Insecta is still lacking, making it difficult to uncover the common principles underlying species-specific features and thereby limiting the exploration of the fundamental logic of insect olfaction.
Within the class Insecta, Orcos exhibit exceptional conservation (>400 Mya evolutionary stability) (
Larsson et al. 2004
;
Brand et al. 2018
;
Robertson 2019
;
Wicher and Miazzi 2021
), whereas lineage-specific ORs display unprecedented diversity (∼30% identity,
Fig. 2B
), far exceeding that of vertebrate ORs (∼80% identity,
Fig. S1B and C
). While recent cryo-electron microscopy breakthroughs have shed light on OR-Orco activation gating mechanisms (
Wang et al. 2024
;
Zhao et al. 2024
), the evolutionary interplay between receptor family diversification and macroecological adaptation remains a profound enigma in evolutionary biology. Traditional phylogeny-driven subfamily categorization, constrained by extreme cross-order sequence divergence, fails to capture the continuum of OR evolutionary innovation (
Zhou et al. 2012
;
Zhou et al. 2015
;
Mitchell et al. 2020
;
Legan et al. 2021
;
Tian et al. 2022
;
Yin et al. 2022
). Unlike vertebrate G protein-coupled ORs, insect ORs assemble with three nonligand-binding Orco subunits into ligand-gated ion channels, an architectural innovation accompanied by striking evolutionary contrasts (
Jones et al. 2005
;
Nei et al. 2008
;
Kaupp 2010
;
Jones et al. 2011
;
Wang et al. 2024
;
Zhao et al. 2024
). The mechanistic drivers of this functional divergence raise key evolutionary questions: What were the key factors that drove the emergence of Orco and the formation of the insect-specific OR–Orco olfactory perception model, and what advantages did it provide?
Identifying the binding profiles of ORs for VOCs is fundamental to understanding how insect olfactory systems perceive and adapt to their environments (
McBride et al. 2014
;
Auer et al. 2020
). To date, numerous studies have characterized the ligand-binding profiles of various insect ORs using heterologous expression systems (
Hallem and Carlson 2006
;
Carey et al. 2010
;
de Fouchier et al. 2017
;
Guo et al. 2021
;
Chang et al. 2023
;
Jiang et al. 2024
). However, when attempting to investigate the functional relevance of tens of thousands of ORs across the class Insecta at a macroevolutionary scale, experimental methods are no longer feasible due to their long timeframes and low throughput. Consequently, theoretical prediction has become the only viable approach. Machine learning approaches are limited by the size of available training datasets and exhibit poor scalability when applied across species on a large scale (
Boyle et al. 2013
;
Chepurwar et al. 2019
;
Caballero-Vidal et al. 2020
). Therefore, molecular docking remains the mainstream approach for ligand screening (
Lyu et al. 2019
;
Comte et al. 2025
). This strategy has already proven successful in mammals: by employing large-scale molecular docking and OR binding profile prediction, researchers have revealed differences in olfactory perception among bats with different diets, as well as dynamic trade-offs between vision and olfaction in primates (
Zhang et al. 2024
;
Chi et al. 2025
). These results suggest that molecular docking can facilitate the exploration of macroevolutionary patterns.
In this study, we reconstructed the evolutionary history of 450 million years of OR through a multilevel analysis of the OR superfamily of 115 insect species spanning 16 orders. Using a newly developed pipeline combining network analysis and protein structure and function prediction, we constructed a sequence similarity network (SSN), a structural similarity network (StSN), and a functional similarity network (FSN) for insect ORs and performed similarity community classification to investigate OR relationships from three distinct perspectives. The results revealed that holometabolous and nonholometabolous insects exhibit distinct OR differentiation patterns and that the composition of functional ORs in insects significantly differed before and after the end-Permian mass extinction (EPME) event. Moreover, the β-sheet structure of the extracellular loop 2 (EL2) region in Orco, along with its highly specialized ligand-binding pocket, plays a critical role in the loss of ligand-binding function and the evolutionary origin of Orco. In addition, we systematically revealed broad evidence of adaptive evolution linking the potential olfactory repertoire to different lifestyles at the scale of the class Insecta.
Results
Characterization of the insect odorant receptor gene repertoire
We compiled all published insect genomes (as of December 2022), selecting the highest-quality genome assembly (contig N50 > 1 Mb) from each family as the representative species. Our study includes 115 species, featuring 8 representative species from different insect orders with previously annotated ORs, spanning 16 orders and 111 families. This approach ensured a comprehensive analysis across the class Insecta (
Fig. 1A
and Data S1). To increase annotation reliability, we implemented the most stringent protein superfamily member screening strategy to date (
fig. S1D
). A total of 8,912 intact ORs were successfully annotated and curated (Data S2). Our analysis revealed substantial variation in OR counts across insect species. Hymenoptera exhibited the highest number of OR, with an average of 174.5 ± 110.7 (mean ± SD, N = 23) and accounted for 8 of the top 10 species with the largest OR repertoires. In contrast, Odonata had the fewest intact ORs, with a mean of 4 (N = 3). Hymenoptera also showed the widest range in OR counts (min: 38, max: 473, N = 23), followed by Coleoptera (min: 9, max: 271, N = 15) (
Fig. 1B
).

Evolutionary ecology of insect OR repertoires.
(A). Phylogeny of 115 insect species (see Methods and Data S4 for details). Genome size and the number of OR genes for each species are shown as bar plots. Ecological parameters, including larval and adult diets, habitat, and circadian rhythm, are displayed as labels with color coding corresponding to the legend below. Different geological periods are separated by shaded intervals. The tree was visualized using the iTOL (
Letunic and Bork 2024
). (B). Boxplot showing the number of OR genes for each insect order. (C). Relationship between genome size and OR gene number across 114 insect species. Each point represents one species. The gray shading indicates the 95% confidence interval. (D-E). Results of two-sided pGLS tests assessing the relationship between intact OR gene numbers and various ecological parameters: adult diet (D), larval diet (E), circadian rhythm (F), and habitat (G). Dots represent OR counts of each species. N represents the counts of species. Animal silhouettes were obtained from
.
© 2014, Descouens and Keesey. The
Rhyacophila dorsalis
silhouette is reproduced from
phylopic
, and available under a
CC BY-SA 3.0 license
.
© 2013, Stemonitis and Keesey. The
Petrobius maritimus
silhouette is reproduced from
phylopic
, and available under a
CC BY-SA 3.0 license
.
We found no significant correlation between the number of ORs and genome size across all the insect species analyzed (P = 0.0958,
fig. S1E
and Data S1). However, we observed that
Locusta migratoria
exhibited a sharp increase in genome size, primarily due to transposable element proliferation (
Wang et al. 2014
;
Li et al. 2024
). When
L. migratoria
was excluded from the analysis, the OR gene number and genome size were significantly negatively correlated (P < 0.01,
Fig. 1C
). These findings suggest that, except for the order Orthoptera, the evolutionary trajectories of genome size and OR gene repertoire size generally oppose those of insects, potentially driven by distinct environmental factors and/or life habit traits.
Previous studies have shown that in certain insect orders and specific lineages, OR repertoire characteristics are associated with various ecological behaviors (
McBride 2007
;
Liu et al. 2021
;
Schrader et al. 2021
;
Jongepier et al. 2022
;
Singh et al. 2025
). To determine whether these relationships extend to the class Insecta, we analyzed four ecological factors: adult diet, larval diet, habitat, and circadian rhythm (Data S3). Adult and larval diets represent stage-specific ecological traits, and our analysis of OR gene numbers at the genomic level aimed to reveal their relationship with long-term evolutionary pressures shaping OR gene family size. Our results revealed a significant correlation between insect OR counts and dietary preferences, both in adults (
Fig. 1D, P
= 0.61 × 10⁻⁶) and larvae (
Fig. 1E, P
= 0.02756). Habitat was also significantly associated with OR counts (P = 0.03984), with terrestrial insects exhibiting more ORs than aquatic insects do (
Fig. 1F
). However, there was no significant correlation between circadian rhythm and OR count (P = 0.3952) (
Fig. 1G
). Overall, our findings suggest that insect OR counts correlate with dietary specialization (in both larvae and adults) and habitat type but are not associated with circadian rhythm.
OR sequence similarity network
This study includes species representing the full phylogenetic diversity of the class Insecta, and their OR sequences exhibit substantial variation in amino acid similarity (min = 13.7%, max = 97.6%, and mean = 29.6%) (
Fig. 2B
). The traditional method of classifying subfamilies on the basis of bootstrap values of phylogenetic tree nodes suffers from reduced precision and accuracy. Therefore, we constructed an SSN on the basis of an "ALL vs. ALL" sequence alignment. In the SSN, each node represents a cluster of ORs sharing at least 60% sequence similarity, and edges are drawn between nodes if the average alignment E value < 1e-25 (
fig. S2A
). Nodes with a greater number of connections indicate closer evolutionary relationships.
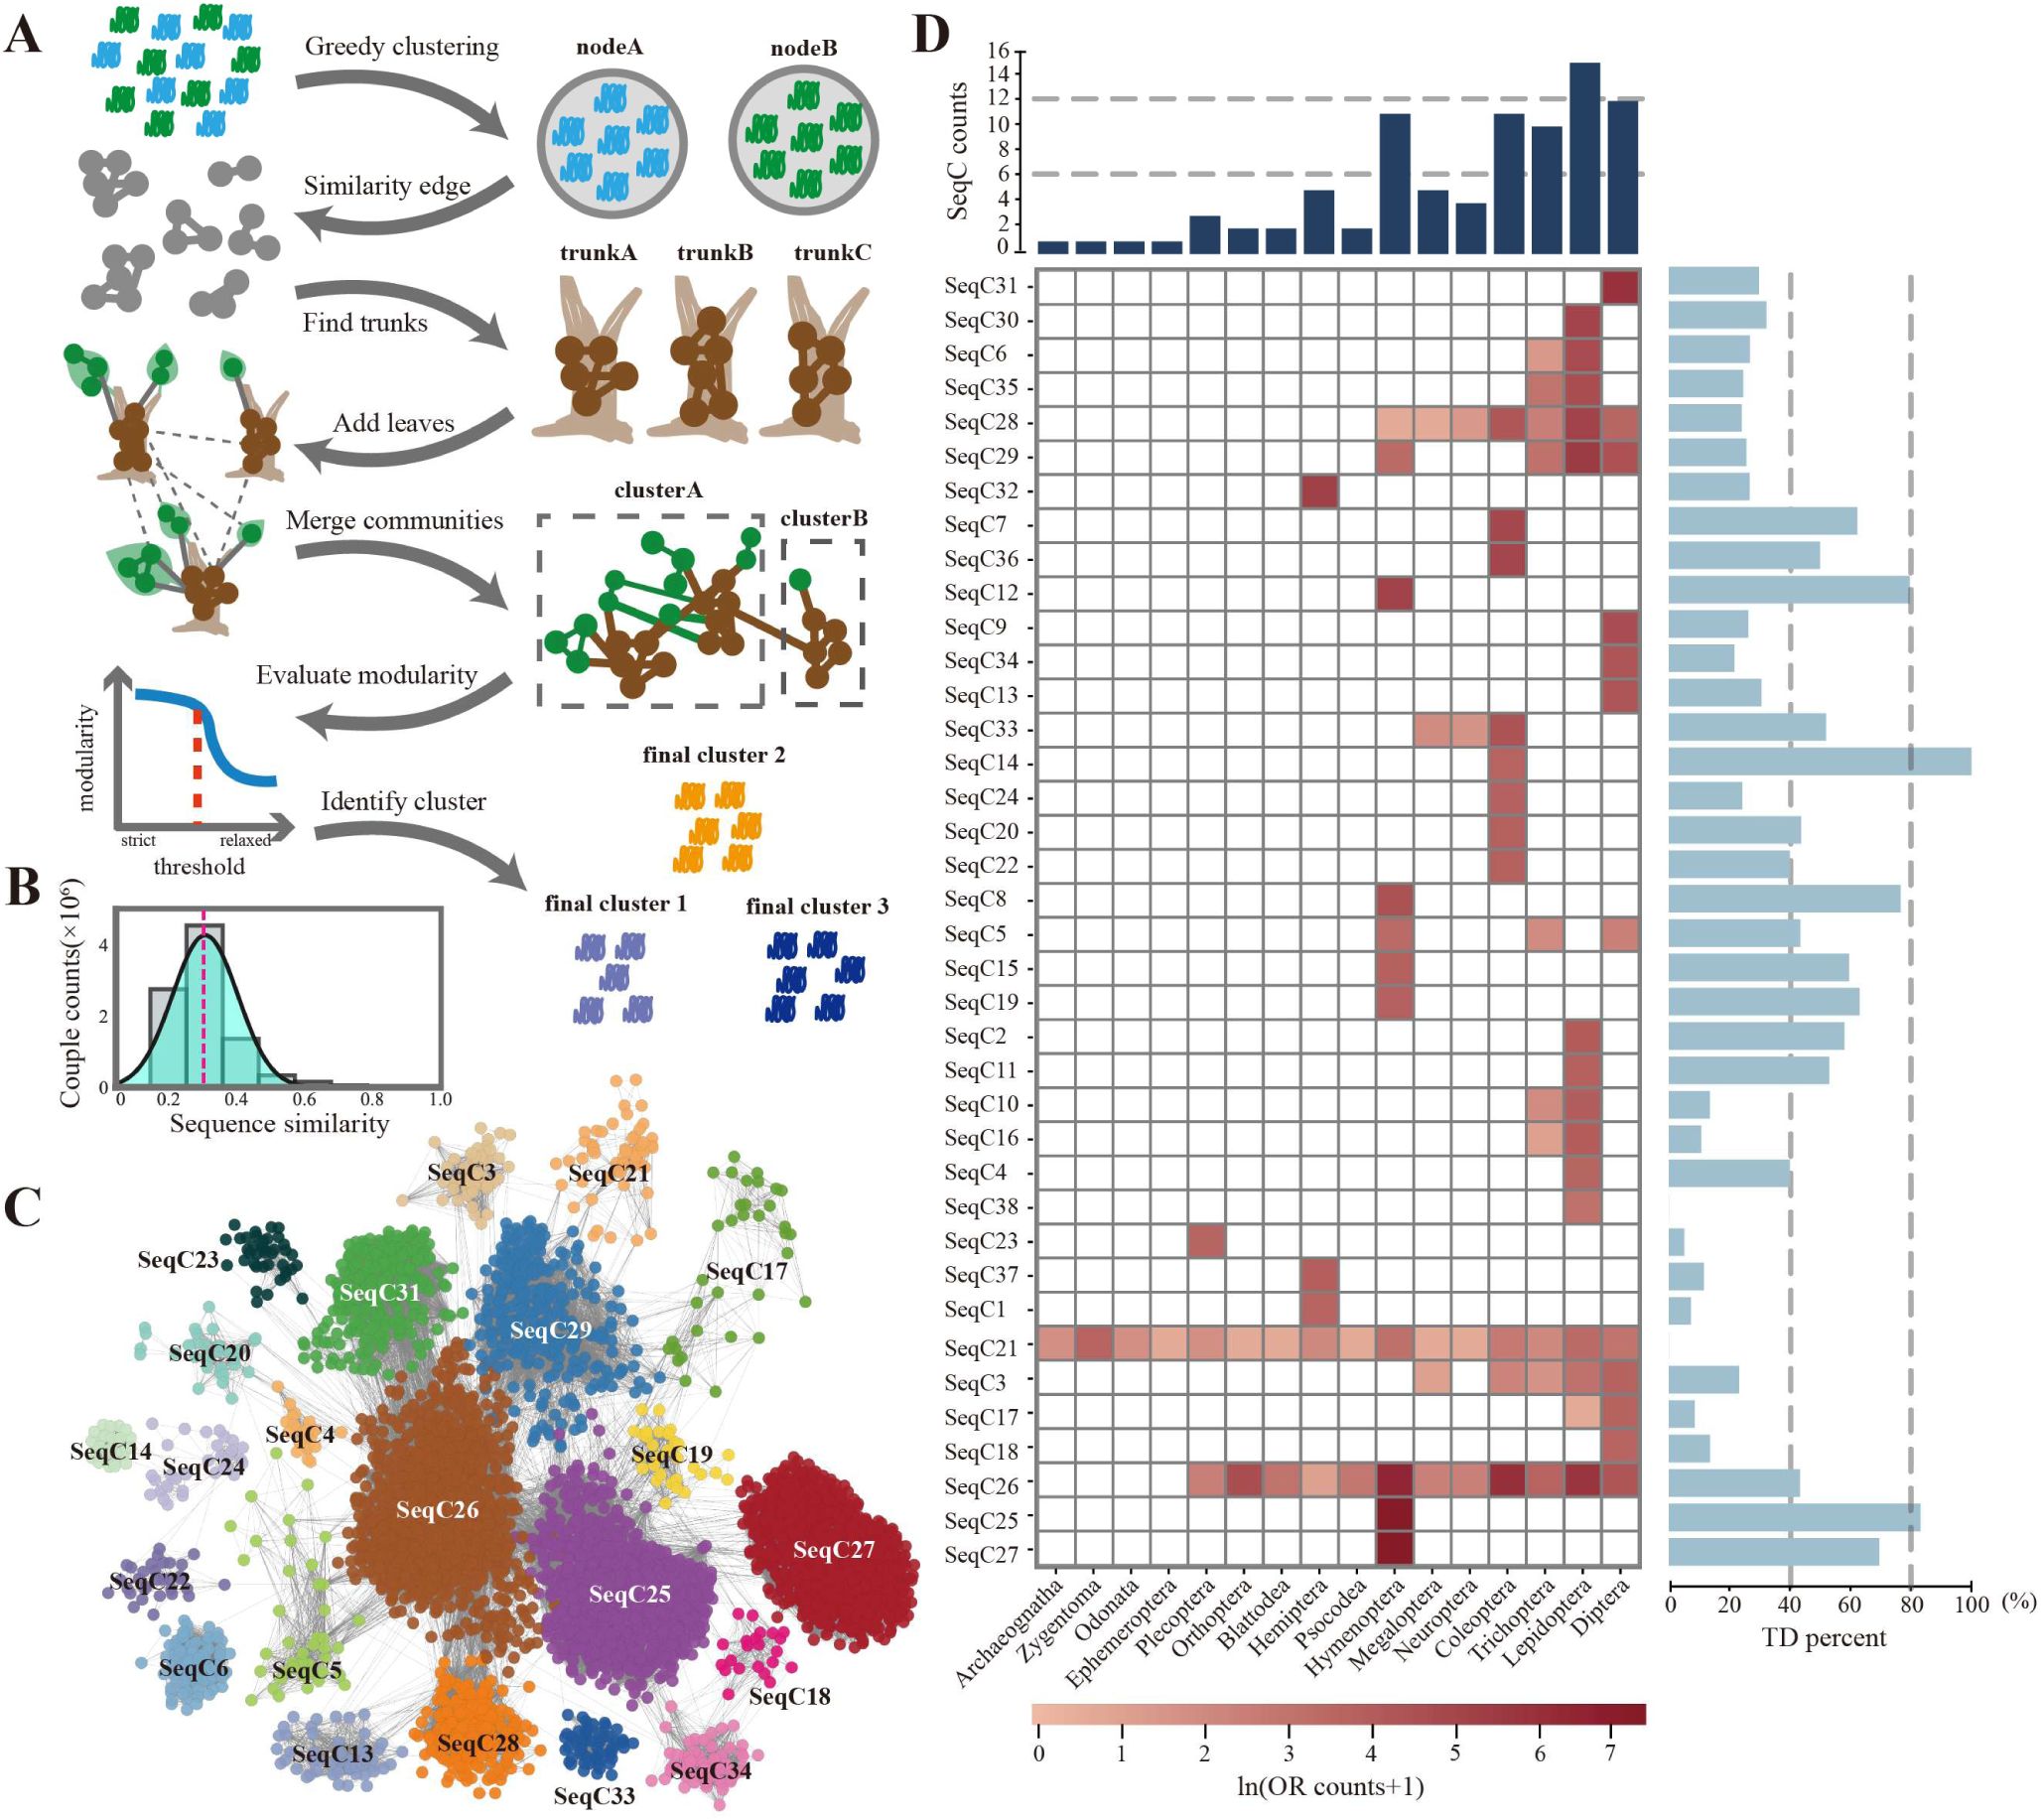
Subfamily classification of ORs based on SSN.
(A). Schematic representation of the “trunk-branch” strategy pipeline for constructing the similarity network and classifying subfamilies. First, all ORs were subjected to greedy clustering based on sequence similarity to generate nodes. The average similarity between nodes was then calculated, and nodes were treated as units to identify core regions (trunks) using a strict similarity threshold. By gradually relaxing the threshold, new core regions and additional nodes (branches) emerged. After a final merging step based on defined criteria, the optimal community structure was determined using modularity as an index (see Methods). (B). Distribution of pairwise sequence similarity among all ORs. The red line indicates the mean similarity. (C). SSN of ORs constructed using the “trunk-branch” strategy. Each node represents ORs sharing >60% sequence identity. Edges represent node pairs with an average sequence alignment E-value of ≥ 1 × 10⁻²⁵. Node colors indicate SeqC classifications. (D). Heatmap depicting the number of ORs within different SeqCs across various insect orders. Due to substantial differences in OR numbers among orders, the values are ln-transformed. The bar plot above the heatmap shows the number of SeqCs present in each order, while the bar plot on the right indicates the proportion of ORs within each SeqC generated by tandem duplication. Two ORs located within 5 kb of each other on the genome were defined as tandem duplicates. TD: Tandem Duplication.
Using the "trunk–branch" strategy (
Fig. 2A
), we identified 38 OR sequence communities (SeqCs), which together account for 94.9% of all ORs. Among them, 22 SeqCs demonstrated clear interaction relationships (
Fig. 2C
and Data S5). The sequence similarity within each SeqC was predominantly between 20% and 30% (
fig. S2B
). By mapping previously classified
Acromyrmex echinatior
sequences using phylogenetic methods (
Zhou et al. 2015
), we found that most subfamilies—such as 9-exon, Orco, F, H, B, and A—were independently delineated (
fig. S2C
) and exhibited well-defined boundaries (
fig. S2E
). Our classification did not disrupt any known subfamilies and instead merged some families with minor differences (
fig. S2
, C and D). We further evaluated the SSN using a curated set of pheromone receptors (PRs) of moths (
Yang et al. 2022
) and found that 81.2% clustered into SeqC6, suggesting it may represent a PR clade (
fig. S2F
). The remaining ∼19% were scattered across other SeqCs, supporting the hypothesis of multiple independent origins of PRs (
Bastin-Heline et al. 2019
). These results further support the applicability and robustness of SSN-based community partitioning.
SeqC21 includes the Orco group as well as all ORs from
Thermobia domestica
and
Machilis hrabei
(
fig. S2G
), suggesting that ORs in early wingless insects share high sequence similarity with Orco. In addition to SeqC21, most SeqCs are order specific, indicating substantial sequence divergence among ORs from different insect orders (
Fig. 2D
). Lepidoptera was found to contain the greatest number of SeqCs, reflecting the highest level of OR sequence divergence. Additionally, we identified SeqC25 and SeqC27 as two exceptionally large, Hymenoptera-specific groups, comprising 39.8% and 31.9% of all Hymenopteran ORs, respectively. SeqC27 corresponds to the previously identified Hymenopteran 9-exon family (
fig. S2
, C and D), which originated through tandem duplication events (
Engsontia et al. 2015
;
Zhou et al. 2015
;
McKenzie et al. 2016
;
Legan et al. 2021
). Interestingly, we found that SeqC25 exhibited an even higher rate of tandem duplication than did SeqC27, suggesting that SeqC25 also expanded through extensive tandem duplication. Notably, among SeqCs with tandem duplication rates exceeding 60%, 5 of 7 are exclusive to Hymenoptera, indicating that OR lineages in this order have undergone particularly intense tandem duplication expansion compared with other insect orders.
Structural group diversity within the ORs
Insect ORs fall within the "twilight zone" (10%–40% sequence identity) of sequence alignment. However, nearly all ORs remain within the "safe zone" in structural alignment (
Fig. 3A
).
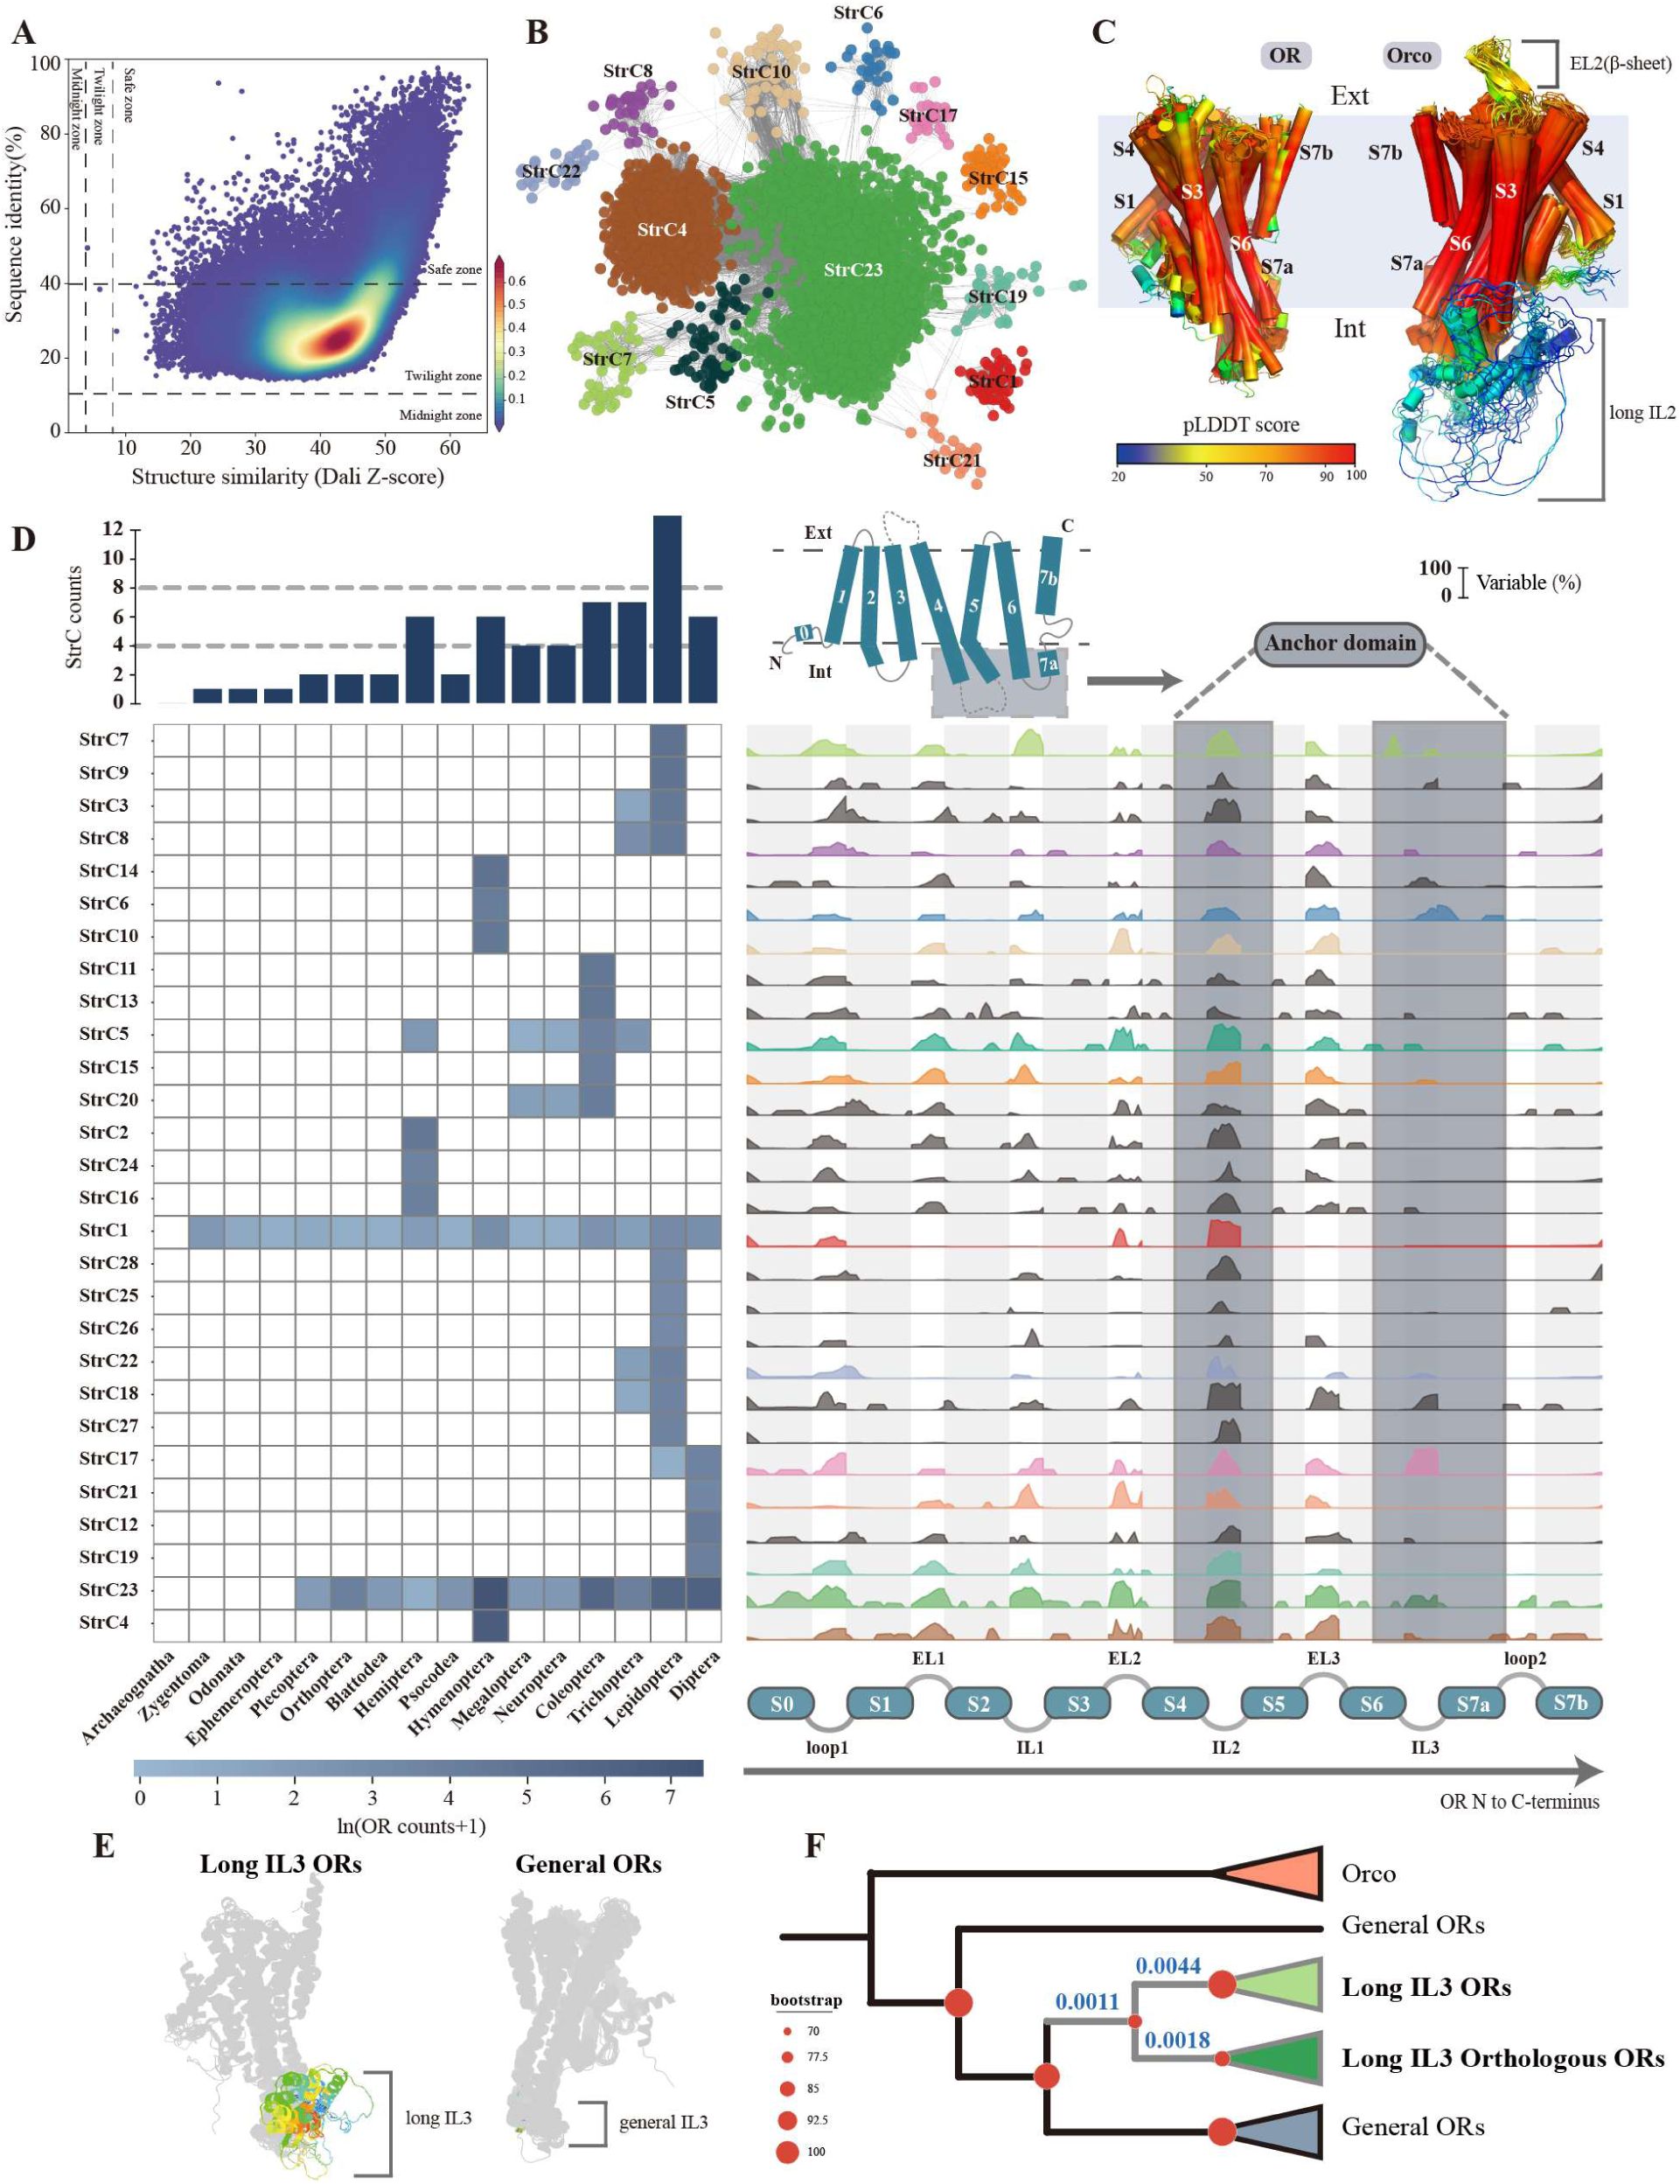
StSN and structural community diversity of ORs.
(A). Sequence similarity versus structural similarity of insect ORs, assessed using pairwise comparisons with Dali. Each dot represents comparison between a pair of ORs, with color indicating point density. (B). StSN of ORs constructed using the “trunk- branch” strategy. Nodes represent ORs with pairwise Dali Z-scores >50. Edges connect nodes with an average pairwise Z-score of at least 42.9. Node colors denote StrCs classifications. (C). Structural comparison of ORs and Orco. The structures were aligned using US-align, with multiple structural alignments performed for annotated Orco and OR structures (visualized in PyMol). Colors represent pLDDT scores provided by AlphaFold2, indicating the confidence of structural modeling. (D). Visualization of differences among StrCs. The heatmap shows the number of ORs within different StrC across insect orders, with OR counts ln-transformed due to large inter-order variations. The bar plot above the heatmap indicates the number of StrC in each order. On the right, a ridge plot illustrates the flexibility rates of different structural regions across StrCs. Flexibility rate = 1 - conservation rate. Light gray represents transmembrane regions, white denotes loop regions, and dark gray marks the anchor domain of ORs. Colors correspond to StrCs, with gray indicating StrCs without interactions. (E). Two types of ORs in StrC17 — long IL3 ORs and general ORs — with the IL3 regions highlighted in color. (F). Phylogenetic analysis of StrC17 ORs based on amino acid sequences. Red circles indicate bootstrap values, with most ORs collapsed based on bootstrap support. Gray branches represent the clade of long IL3 ORs, and the dN/dS values are shown in blue on the corresponding evolutionary branches.
To investigate the structural diversity of insect ORs, we constructed a StSN, where each node represents ORs with Z score > 50 (from Dali (
Holm 2022
)). Edges were drawn between nodes if their average Z score was > 42.9 (
fig. S3A
). Similar to the SSN, we classified 28 structural communities (StrCs), which together accounted for 87.0% of all ORs. Among these, 13 StrCs exhibited distinct interaction relationships (
Fig. 3B
and Data S5). The boundaries between StrCs were well defined (
fig. S3C
).
Most StrCs were also order specific (
Fig. 3D
). StrC1 represents the Orco group, which includes 8
T. domestica
ORs. These ORs were previously identified as Orco-like genes through sequence analysis (
Brand et al. 2018
). Compared to ORs, Orco is characterized by two distinct structural features: a β-sheet in EL2 and a long loop in intracellular loop 2 (IL2) (
Fig. 3C and fig
. S3B). Lepidoptera presented the highest diversity of StrC types (
Fig. 3D
). We found that the transmembrane regions in different StrCs presented low variability, whereas the loop regions presented distinct variable patterns (
Fig. 3D
). In both ORs and Orcos, the IL2 region was identified as the most variable region and the only variable segment within the anchor domain. This high degree of variability may be associated with its role in stabilizing and regulating the anchoring domain (
Bahk and Jones 2016
;
Jain et al. 2021
;
Wang et al. 2024
;
Zhao et al. 2024
).
Notably, StrC17 exhibited a high degree of flexibility in the IL3 region. We observed that a subset of ORs within this group possessed unusually long IL3 regions (
Fig. 3E
). These ORs were distributed across 15 families from two suborders of Diptera, but they were absent from the earliest-diverging families in the Nematocera suborder, including Culicidae, Chironomidae, and Tipulidae (
fig. S3
, E and F). After manual inspection, annotation errors were ruled out. The construction of a maximum likelihood tree for StrC17 ORs revealed that ORs with long IL3 regions formed a distinct clade, with one subclade identified as orthologous (
fig. S3D
). To investigate the evolutionary pressures acting on these ORs, we calculated the dN/dS ratios for different branches (
Fig. 3F
and Data S6). The results revealed that all StrC17 ORs were subject to strong purifying selection (dN/dS = 0.17). The amino acid substitution rate of ORs with long IL3 regions was two orders of magnitude lower than that of other ORs (dN/dS = 0.001–0.004), indicating intensified purifying selection. Further analysis of functional group classifications (described later) revealed that nearly all ORs with long IL3 regions (18/19) were either narrowly tuned or had unknown functions, suggesting that these ORs may play highly conserved olfactory roles.
Origin and driving factors of Orco
Orco originated in the ancestor of Zygentoma and evolved from ORs (
Brand et al. 2018
;
Thoma et al. 2019
). The evolutionary drivers underlying Orco specialization remain unresolved. Our phylogenetic analyses revealed that early-diverging insect ORs lack direct orthologs, precluding the reconstruction of ancestral ORs (
fig. S4A
). The
T. domestica
ORs TdomOR1-8 are classified within Orco communities (SeqC21 and StrC1) and occupy a transitional phylogenetic position between ORs and characterized Orcos (
fig. S4B
), representing the closest ORs related to Orcos. Therefore, we propose that TdomOR1-8 were candidate receptors during the recruitment and expansion of the co-receptors in the ancestral lineage of Zygentoma. We found that TdomOrcoFJ has the smallest, least polar, and most hydrophobic binding pocket among TdomOR1-8 (
Fig. 4A
). Molecular docking analysis revealed that TdomOrcoFJ is less suited for VOC binding than other candidates are (
fig. S4C
). These findings suggest that the extreme characteristics of the binding pocket are key features that distinguish TdomOrcoFJ from other candidate Orcos, with a reduced VOC-binding capacity serving as the primary driving force in Orco determination.
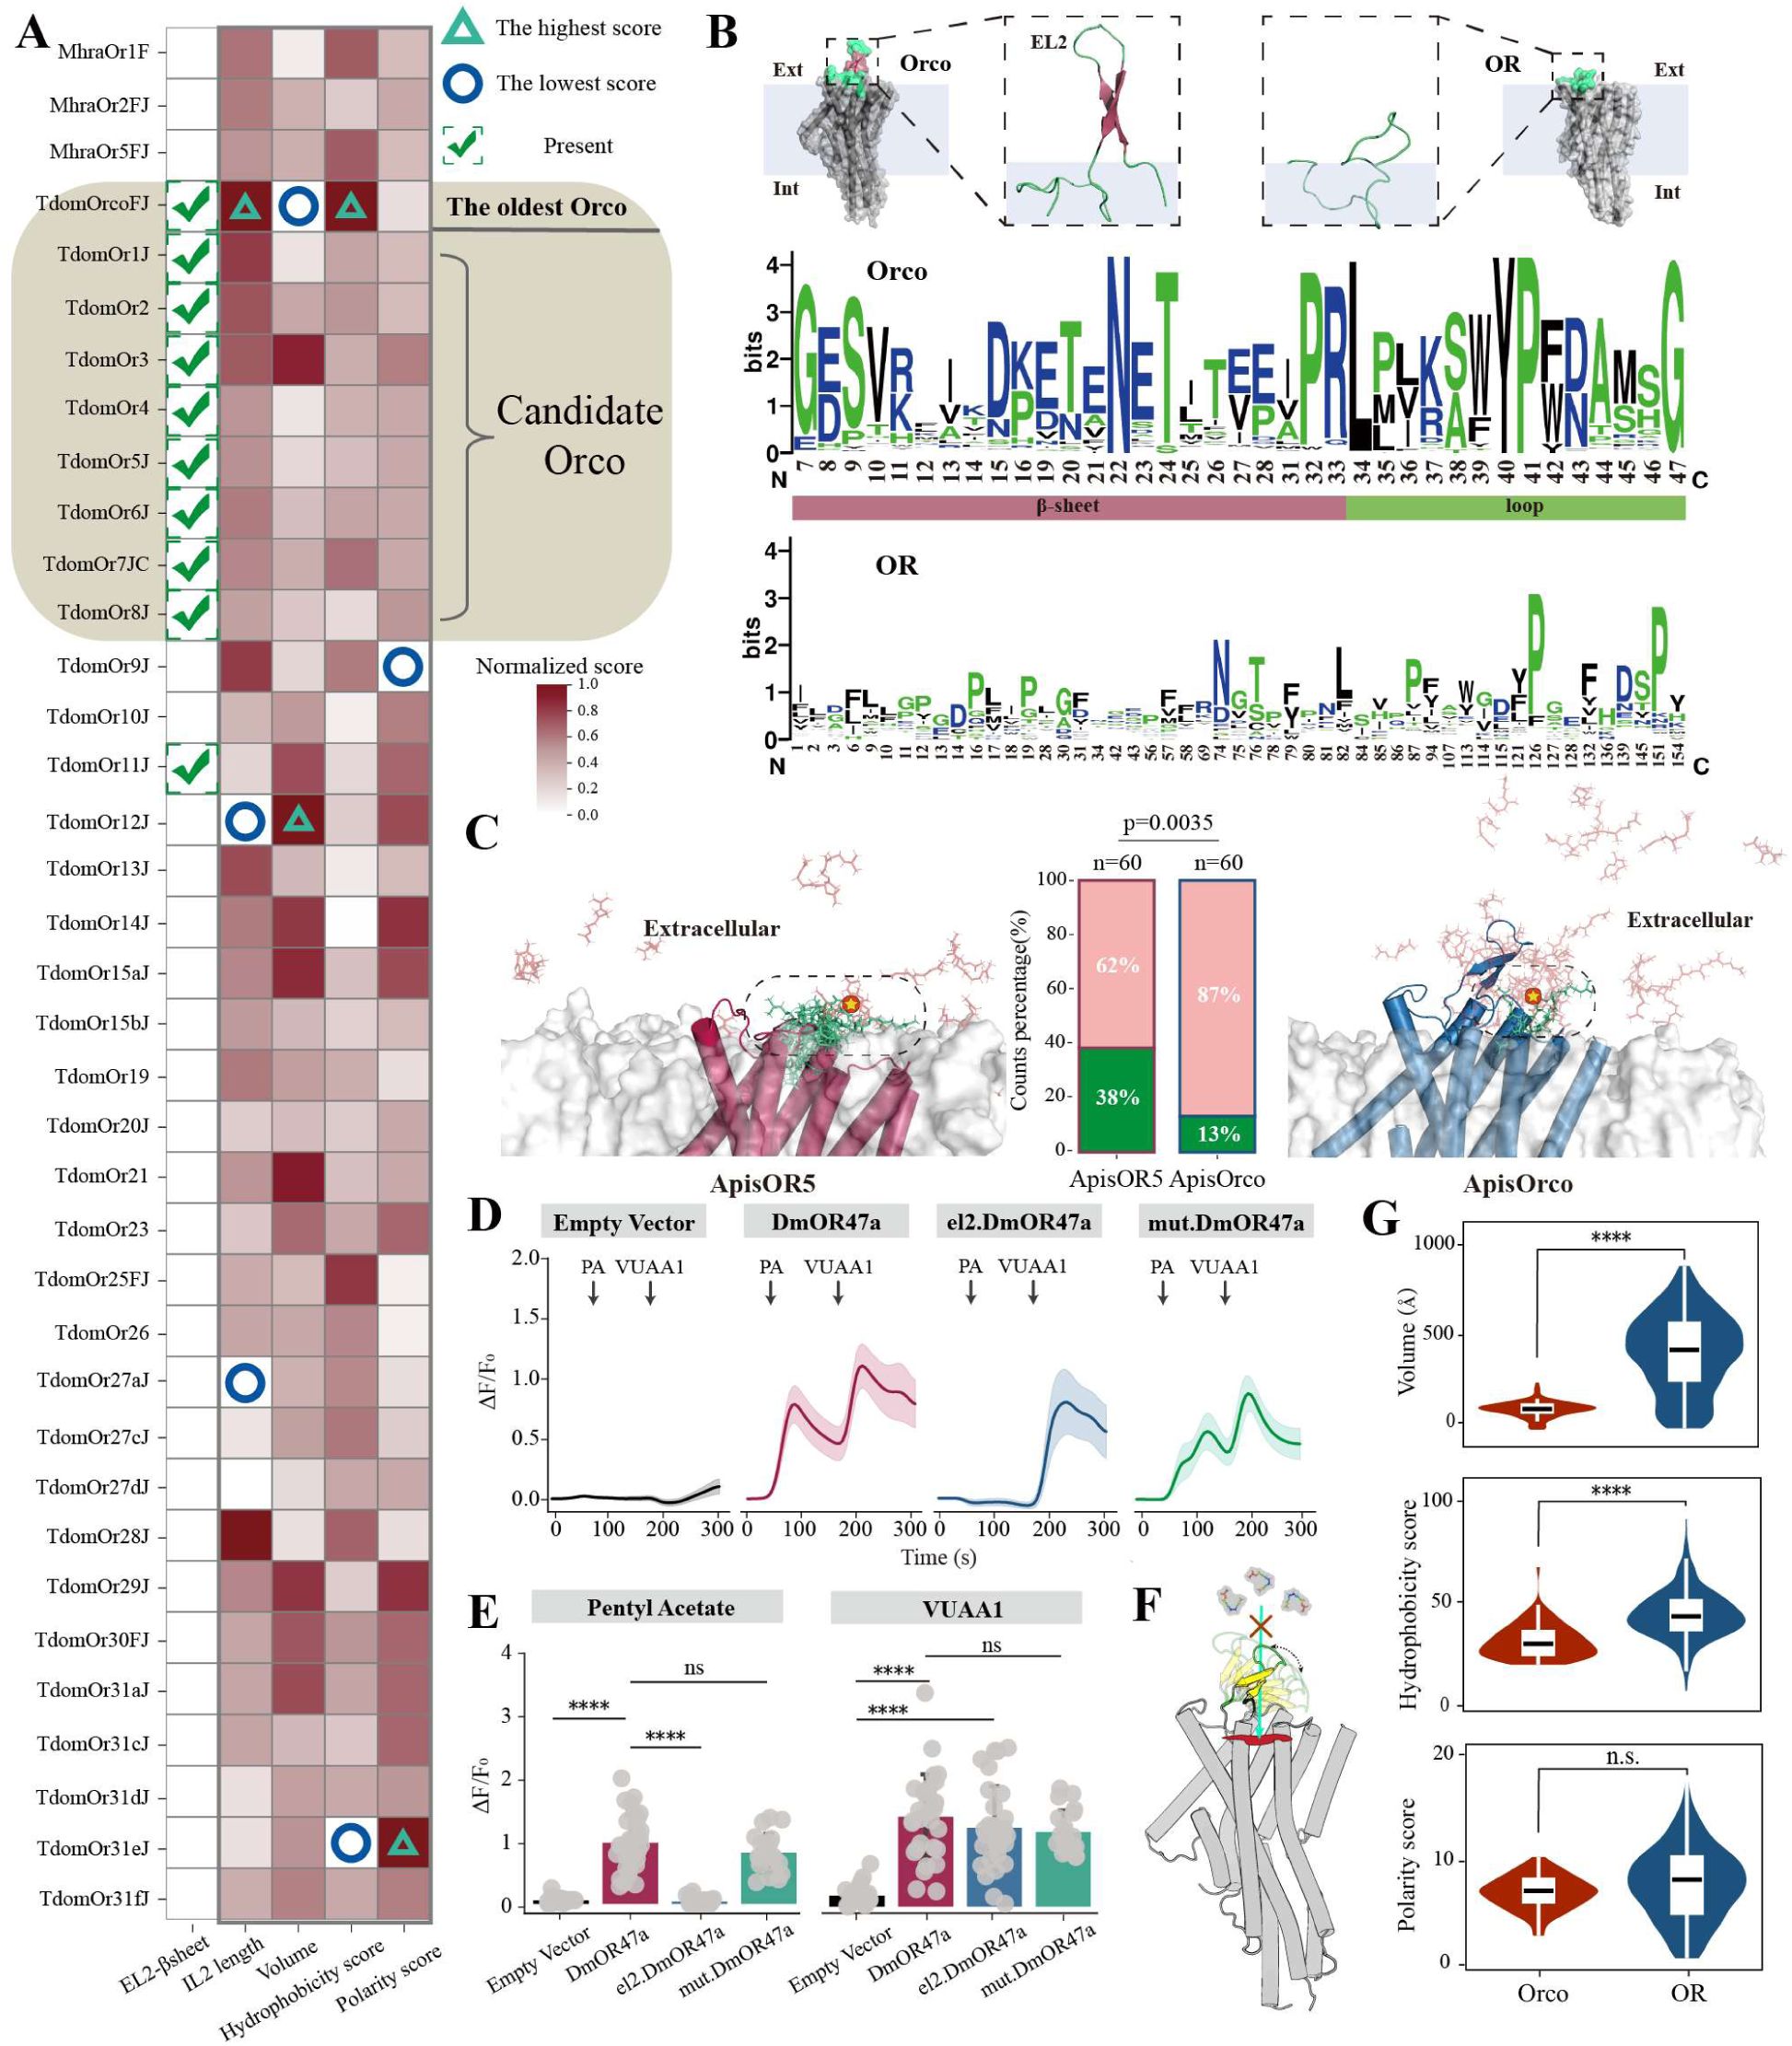
Drivers promoting the early origin of Orco.
(A). Differences in EL2, IL2, and binding pocket properties between
M. hrabei
and
T. domestica
ORs. Only ORs with closed binding pockets were analyzed, and all scores were normalized. Circles and triangles represent the minimum and maximum scores after column normalization, respectively. The presence of an EL2 β-sheet is indicated with a check mark. (B). Differences in amino acid properties of the EL2 region between OR and Orco. Hydrophilic amino acids are shown in blue, neutral amino acids in green, and hydrophobic amino acids in black (visualized by WebLogo (
Crooks et al. 2004
)). The x-axis numbers represent amino acid positions from the multiple sequence alignment, with highly gapped positions removed. (C). MD simulation-based analysis of the movement trajectory of VOC (geranyl acetate) near Orco and OR. The red protein represents ApisOR5, and the blue protein represents ApisOrco. The green area indicates the probability of VOC remaining above the binding pocket, while the pink represents its probability of occupying other regions of the protein (see Methods). Statistical significance was evaluated using a Chi-Squared Test. The red pentagram indicates the initial position of geranyl acetate in the simulation. (D). Changes in relative calcium fluorescence intensity (ΔF/F0) in cells. Cells were stimulated with 100 μM of the OR47a agonist pentyl acetate (PA) at 50 s and 100 μM the Orco agonist VUAA1 at 180 s. el2.DmOR47a: OR47a mutant in which the EL2 region of OR47a was replaced with that of Orco. mut.DmOr47a: the EL2 region of wild-type DmOr47a contains an inserted short peptide. The total number of cells (n = 30) was derived from three independent replicate experiments. The shading indicates the 95% confidence interval. (E). Relative calcium fluorescence intensity in cells following stimulation with PA and VUAA1, respectively. n=30. Statistical significance was determined using Tukey’s HSD test. (F). Schematic illustration of the mechanism by which the β-sheet structure in the EL2 region of Orco influences VOC proximity to the binding pocket. (G). Comparative analysis of binding pocket parameters (volume, hydrophobicity score, and polarity score) between Orco and ORs across all studied insect species. Statistical significance was determined using a two-sided t-test. **** P < 0. 0001.n.s. no significant.
The reasons behind the loss of Orco function remain unclear, although its conserved binding pocket may act as a molecular sieve (
Pacalon et al. 2023
). We found that
M. hrabei
ORs lack the EL2 β-sheet but have a long IL2 loop region. Similarly, most
T. domestica
ORs also have a long IL2 loop region, whereas only TdomOR1-8 retains the EL2 β-sheet (
Fig. 4A
). This finding suggests that the long IL2 loop region was conserved from ancient ORs but gradually disappeared during subsequent evolution. In contrast, the EL2 β-sheet likely emerged during Orco evolution and was retained in all subsequent Orcos.
The formation of the EL2 β-sheet may be associated with the loss of Orco function. We observed that the EL2 region of Orco is distinctly divided into two parts: the β-sheet region and the transmembrane loop region (
Fig. 4B
). In the β-sheet region, the proportion of hydrophilic amino acids is 47.8%, whereas it is 14.2% in the transmembrane loop region and 18% in ORs. Overall, across all the insects, the β-sheet region of Orco EL2 presented a significantly greater proportion of hydrophilic amino acids than did the ORs (
fig. S4D
), facilitating its stable presence in the extracellular aqueous environment. The extracellular port is the main pathway through which ligands enter the binding pocket (
Renthal and Chen 2022
;
Pacalon et al. 2023
). Using molecular dynamics (MD) simulations to analyze VOC movement outside the membrane, we found that the presence of the β-sheet in EL2 region significantly reduced the likelihood of VOCs reaching the binding pocket (
Fig. 4C
,
fig. S4E and M
ovie S1). Using Drosophila OR47a as an example, we demonstrated through calcium imaging experiments that replacing the EL2 region of OR47a with that of Orco resulted in a mutant OR47a (el2. DmOR47a) that exhibited a markedly reduced ability to bind pentyl acetate (PA) (
Fig. 4
, D and E and
fig. S4F
). Additionally, we inserted a non–β-sheet short peptide into the EL2 region of OR47a, and the results showed that its function remained unaffected (
Fig. 4
, D and E and
fig. S4F
). This finding suggests that the β-sheet acts as a spatial barrier, limiting VOC access to the binding pocket as a primary physical gate (
Fig. 4F
). Furthermore, we observed that Orco has a smaller and less hydrophobic binding pocket than ORs do (
Fig. 4G
). These characteristics are unfavorable for VOC entry into the binding pocket, representing the key chemical factors contributing to Orco’s loss of natural VOC-binding function.
Functional labels for ORs on the basis of VOC recognition similarity
Currently, molecular docking and virtual screening have been successfully applied to the high-throughput prediction of OR binding profiles in mammals, revealing the macroevolutionary trajectories of species’ olfactory recognition abilities (
Zhang et al. 2024
;
Chi et al. 2025
). To better understand the functions of all insect ORs and classify them accordingly, we collected 14,499 VOCs from 4 molecular libraries (including pheromones (
Li et al. 2023
), fragrances (the
), food odors (
Chi et al. 2025
), and theoretical odors (
Mayhew et al. 2022
)). These VOCs were categorized into 9 functional groups (
Fig. 5A
and Data S7). We used a comprehensive VOC library to systematically evaluate the theoretical functions of ORs, aiming to assess the olfactory potential encoded by the genome, even though some of these compounds may never be encountered by insects in nature.
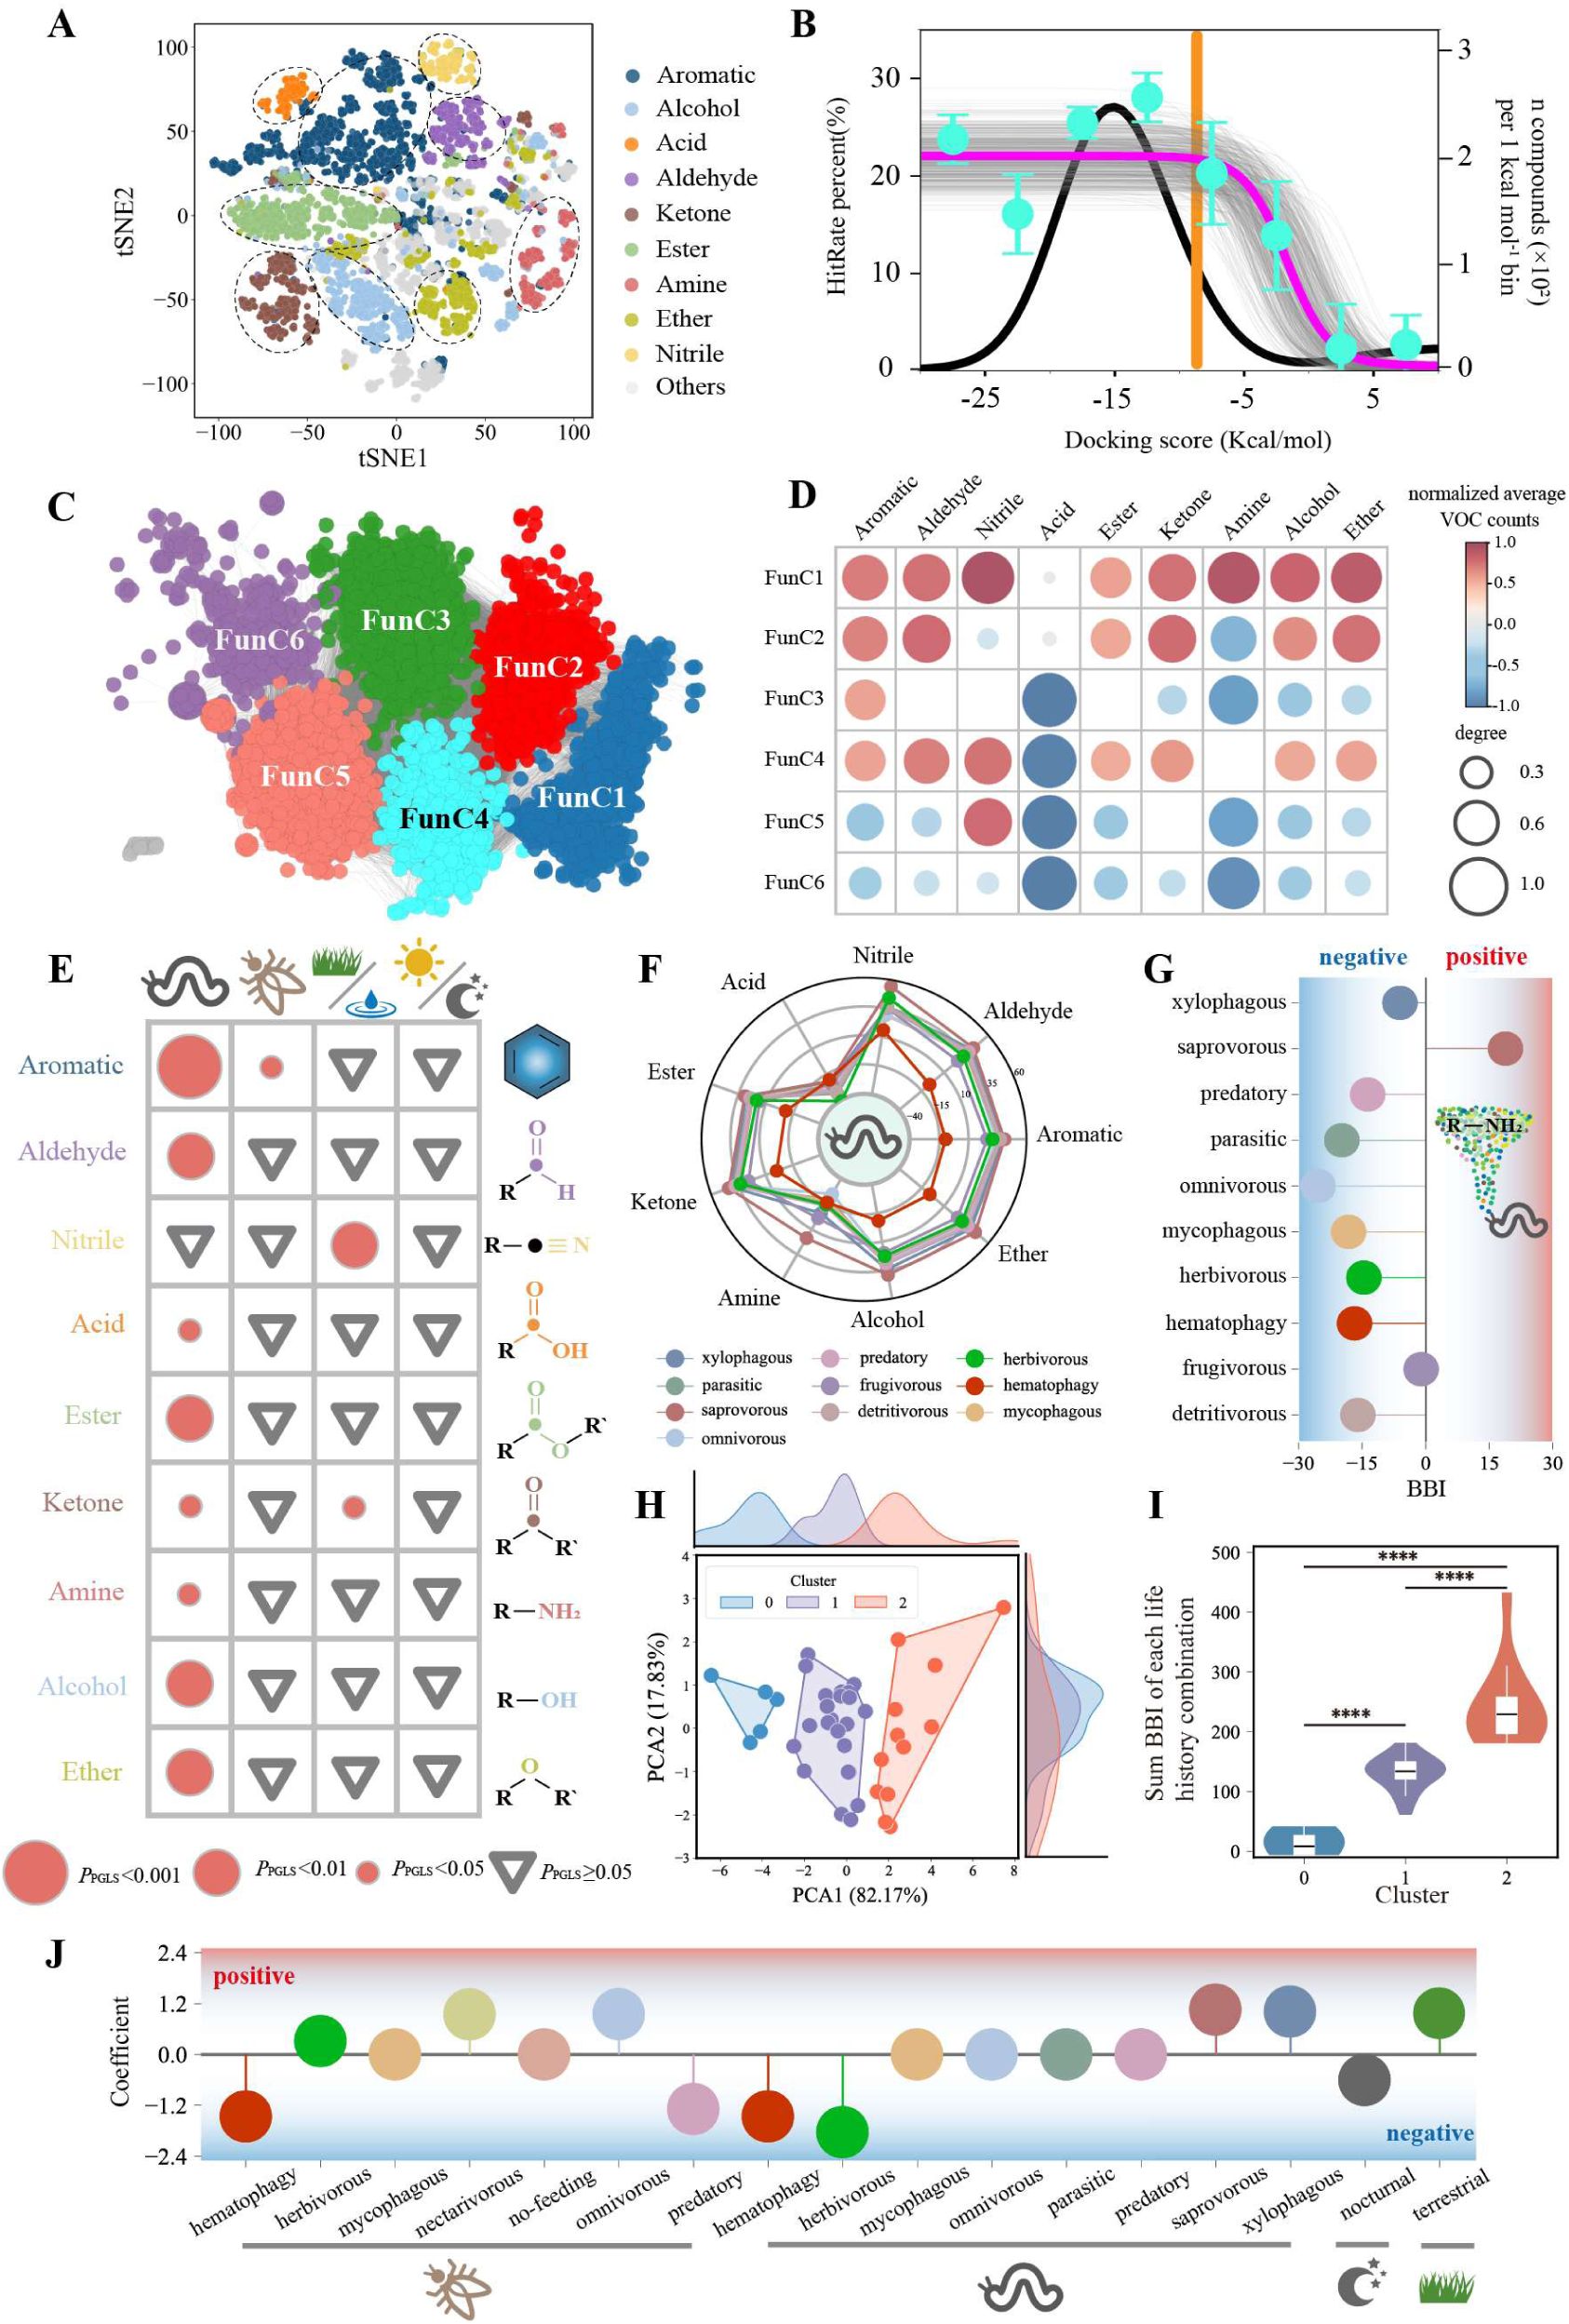
Classification of insect OR functional communities and the relationship between ecological parameters and the VOC recognition capability of ORs.
(A). 2D odor space based on molecule physicochemical properties. Each dot represents an odor molecule, with different colors indicating different functional groups. (B). Relationship between hit rate and docking score, inferred using Bayesian statistics. The black curve shows the distribution of hit rates and docking scores across all OR-VOC docking results. The top plateau has a hit rate of 22%, while the bottom plateau has a hit rate of 0%. Cyan dots represent the mean hit rate ± s.e.m. for each docking score interval. The orange curve indicates the peak hit rate at a docking score of -8 kcal/mol. The gray curve represents posterior distributions from Bayesian inference, with n = 500. (C). FSN and FunC of ORs. Nodes represent ORs with pairwise PCCs > 0.6 based on docking scores. Edges represent node pairs with an average PCCs ≥ 0.48. (D). Functional labels for the recognition of different functional group small molecules by each FunC. Red indicates a tendency to recognize a higher number of odor molecules from a particular functional group, while blue indicates to recognize fewer. Circle size represents the degree of this tendency. (E). Correlation between four ecological parameters and species’ BBI for different VOC functional groups. pGLS tests were used for significance assessment. Red circles represent significant correlations, with size indicating the degree of significance. Gray triangles denote non-significant results. (F). Distribution of BBI values for different VOC functional groups across species with different larval diets. (G). BBI values for amine VOCs recognized by species with different larval diets. (H). 2D distribution of BBI values across species with different life habit combinations. The density distributions of different clusters along PCA1 and PCA2 are shown at the top and right. (I). Summed BBI values for all functional groups across three life habit combinations. One-way ANOVA followed by Bonferroni post-hoc tests was used for significance analysis. (J). Binary logistic regression coefficients for different life habit combinations. ****P < 0.0001
We performed molecular docking for all insect ORs using these VOCs to generate their recognition profiles (
fig. S5A and D
ata S8). A long-standing challenge in molecular docking is how to predict binding likelihood on the basis of ranking scores. To address this issue, we modeled a theoretical "hit rate" curve using docking scores and experimental datasets from Drosophila (
Hallem and Carlson 2006
), mosquitoes (
Carey et al. 2010
), and moths (
de Fouchier et al. 2017
) (
Fig. 5B
). We used the prior probability distribution in Bayesian statistics and determined the effective docking score range for insect ORs. A threshold score of -8 kcal mol-1 was established to maximize data retention while maintaining a reliable hit rate (
Fig. 5B
).
We constructed an FSN for ORs (
Fig. 5C
). In this network, each node represents ORs with a recognition profile Pearson correlation coefficient (PCC) greater than 0.6, and nodes with an average PCC greater than 0.48 are connected by edges. We identified 6 functional communities (FunCs), representing 72.5% of the ORs (
fig. S5B and D
ata S5). We subsequently quantified the number of VOCs with different functional groups recognized by each FunC (
fig. S5C
) and assigned theoretical functional labels on the basis of their significant recognition compared with the background (
Fig. 5D
). The labels represent the breadth of VOC functional group recognition by each FunC. To evaluate the accuracy of these functional labels, we calculated the area under the curve (AUC) by comparing the OR experimental data with the theoretical functional labels. For most functional group predictions, an AUC exceeding 0.75 was achieved, indicating strong agreement (
fig. S5D
).
FunC1 showed broad recognition of almost all functional group VOCs, whereas FunC6 had a limited recognition range, potentially indicating the existence of broad-tuned and narrow-tuned ORs (
Fig. 5D
). Additionally, FunC3 primarily recognized aromatics, whereas FunC5 specifically recognized nitriles. Overall, ORs had the smallest recognition range for acids and amines. Previous studies have suggested that ionotropic receptors (IRs) primarily recognize acids and amines, reducing the selective pressure on ORs to detect these VOCs (
Silbering et al. 2011
).
Unlike SeqC and StrC, almost all insect orders contain all FunCs without exhibiting specificity (
fig. S5E
). The broad-tuned FunC1 dominates in most orders, particularly in Psocodea, Diptera, and Lepidoptera (
fig. S5F
). Additionally, all the insect species presented a minimal proportion of FunC6, indicating that a small number of narrow-tuned ORs are present across all the insects. These ORs are likely specialized to recognize specific VOCs, increasing the ability of a species to adapt to unique environmental conditions (
Hallem and Carlson 2006
;
Carey et al. 2010
;
Zhang et al. 2024
;
Chi et al. 2025
) (
fig. S5F
).
Relationship between OR function and insect life habits
To quantify OR promiscuity in recognizing VOCs, we developed the binding breadth index (BBI), which is based on FunC labels. This metric assigns positive values to ORs that bind to a greater variety of VOCs (higher BBI = broader olfactory breadth) and negative values to those that bind to limited VOCs (lower BBI = narrower olfactory breadth). Using this index, we generated olfactory functional barcodes for different life habits in insect orders (
fig. S6A
), facilitating the comparison of the breadth of VOC recognition across various life habits. It should be noted that the olfactory breadth referred to in the subsequent analyses represents the species’ potential olfactory capacity, as reflected by the full repertoire of OR genes encoded in its genome, rather than the olfactory perception exhibited at a specific developmental stage of the insect.
Phylogenetic generalized least squares (pGLS) analysis revealed differential correlations between ecological traits and VOC class BBI patterns. Larval diet was correlated with the BBI (all except nitriles), whereas adult diet was correlated exclusively with aromatics (P= 0.038) (
Fig. 5E
). Habitat type was associated with nitrile/ketone perception (P= 0.0017/P= 0.003), whereas circadian rhythm was not significantly linked (
Fig. 5E
). Building on earlier results that the OR number was associated with insect diet (
Fig. 1
, D and E), suggesting that larval diet significantly influences both the number and the species’ potential olfactory capacity. In contrast, the circadian rhythm had no apparent effect on either OR number or potential olfactory capacity. Insects with saprophagous larvae ranked first in the BBI for most VOC functional groups, indicating a broader VOC recognition capability than that of insects with other larval diets. In contrast, in insects with hematophagous larvae, the BBIs for all VOCs except nitriles were negative, suggesting that the ORs of these insects tend to bind to fewer VOCs (
Fig. 5F
). Additionally, insects with saprophagous larvae were the only life habit type with a positive BBI for amines (
Fig. 5F, g
and
fig. S6B
). This divergence of potential olfactory capacity correlated with expanded broad-tuned ORs (FunC1) in insects with saprophagous larvae (
fig. S6C
). Although single-parameter ecological classification revealed broad correlations between niche variables and VOC-specific BBI patterns, it failed to resolve combinatorial trait interactions shaping species-level olfactory plasticity.
To resolve combinatorial ecological effects, we defined 3 categories of potential olfactory capacity based on life habit combinations: low (Cluster 0, n=5), moderate (Cluster 1, n=23), and high (Cluster 2, n=12) responsiveness (
Fig. 5
, H and I). Logistic regression identified 11 key types of life habits, including enhancers (terrestrial, xylophagous and saprovorous in larvae, omnivorous and nectarivorous in adults) and suppressors (nocturnal, hematophagic, larval herbivorous, adult predatory) of potential olfactory capacity (
Fig. 5J
). These results support the previously established close relationship between insect ORs function and ecological niches (
McBride et al. 2014
;
Auer et al. 2020
), and further provide a systematic and expanded explanation of the potential association between the olfactory breadth of insects and diverse ecological lifestyles.
Different evolutionary patterns of insect ORs across geological periods
Although the sequence evolution of the insect OR gene family and functional diversity among different orders and species have been reported multiple times (
Brand and Ramirez 2017
;
McKenzie and Kronauer 2018
;
Legan et al. 2021
;
Chang et al. 2023
), these studies reveal only a partial view rather than the overall evolutionary landscape of insect OR sequences, structures, and functions. To elucidate the macroevolutionary trajectories of insect ORs, we integrated SeqCs, StrCs, and FunCs. The results revealed strong congruence between SeqCs and StrCs, with both communities including nearly all FunCs (
Fig. 6 and fig
. S7). This finding indicates that the evolution of OR functions follows a fundamentally different pattern from that of OR sequences and structures.

Relationships between OR sequence structure and functional communities across insect orders.
The phylogenetic tree follows the structure from
Fig.1
. On the right, the mapping relationships between all insect OR SeqCs StrCs and FunCs are shown, considering only ORs classified into communities. Time nodes for different geological periods are based on previous study (
Misof et al. 2014
) and are separated by gray shading. The timeline beneath the tree marks the origin of various insect orders. Animal silhouettes were obtained from
.
© 2014, Descouens and Keesey. The
Rhyacophila dorsalis
silhouette is reproduced from
phylopic
, and available under a
CC BY-SA 3.0 license
.
© 2013, Stemonitis and Keesey. The
Petrobius maritimus
silhouette is reproduced from
phylopic
, and available under a
CC BY-SA 3.0 license
.
Additionally, we found that holometabolous and nonholometabolous insects presented distinct OR differentiation patterns (
fig. S8
). Among ORs with FunC labels, nonholometabolous insects have fewer SeqCs, whereas holometabolous insects display greater SeqC diversity. The number of SeqCs increases progressively with increasing degree of insect order divergence, suggesting a gradual accumulation of sequence variation during insect evolution (
fig. S9A
). Despite the limited SeqC diversity in nonholometabolous insects, all six types of FunC were retained, indicating that functional community types were established early in insect evolution.
The EPME was a significant geological event that resulted in the extinction of most species and caused drastic environmental changes (
Close et al. 2020
;
Jouault et al. 2022
). We detected significant differences in the number of insect OR FunCs before and after the EPME event (
fig. S9B
). Post-EPME insects presented a greater proportion of FunC1 (broad-tuned ORs) and a lower proportion of FunC2 (
fig. S9C
). This finding was confirmed by data showing that the proportion of broad-tuned ORs in Locusta is much smaller than that in Drosophila and Anopheles (
Chang et al. 2023
). These findings suggest that post-EPME insects are characterized by more broad-tuned ORs, which are predominantly transformed from other tuned ORs.
Discussion
In this study, we developed a unified sequence–structure–function classification system to discover insect OR evolutionary trajectories. Our results revealed the mechanism of insect olfactory perception underlying macroenvironmental influences. Next, we comprehensively described the evolutionary process through which Orco emerged within the insect “conserved chassis–diversified sensors” perception model and identified the key driving factors underlying its origin from ORs. Finally, we found broad evidence at the scale of the class Insecta that adaptive evolution links species’ lifestyles to the breadth of their potential olfactory capacity.
The drivers of genome size variation remain a topic of ongoing debate (
Abdel-Haleem 2007
;
Canapa et al. 2015
). Previous studies have shown that genome size is largely determined by non-coding DNA, and its relationship with the number of protein-coding genes and organismal complexity is limited (the C-value enigma) (
Gregory 2005a
;
Gregory 2005b
;
Elliott and Gregory 2015
). Therefore, from a broad perspective, genome size does not directly determine the number of OR genes, but instead reflects a complex evolutionary process. The significant negative correlation observed between genome size and OR number may result from selective pressures imposed by the environment on insect evolutionary strategies, in which the forces driving genome expansion (e.g., transposable element proliferation) and those driving OR gene expansion act in opposite directions across the insect clade.
Despite differences in OR sequences and structural communities, all maintain a complete set of functional clusters. The results demonstrate stronger evolutionary coordination between OR sequences and structural types than between these features and functional types. Specifically, structural variations closely reflect sequence divergence, whereas functional distinctions show limited correlation with structural configurations. This represents a distinctive evolutionary characteristic unique to insect odorant receptor families, which allows all insect orders to contain full functional OR repertoires, despite possessing different sequences and structural communities. Furthermore, major geological events influenced the composition of insect-tuned ORs. Insects that evolved after the EPME event had a greater proportion of broad-tuned ORs, likely influenced by multiple factors. During the Permian–Triassic transition, gymnosperms (such as cycads, lycophytes, and conifers) gradually replaced the previously dominant ferns (
Grauvogel-Stamm and Ash 2005
;
Vajda et al. 2020
;
Lu et al. 2021
). Plant diversification played a key role in driving insect diversification, and herbivorous insects held a central position in the Permo–Triassic interaction network (
Jouault et al. 2022
). The shift in plant composition led to significant changes in insect food sources and host plants. Additionally, EPME led to the extinction of 90–95% of species (
Benton 2016
) and was accompanied by continental reconfiguration, such as the breakup of Pangaea into Laurasia and Gondwana (
Zaffos et al. 2017
), resulting in numerous vacant ecological niches and driving insects to undergo adaptive radiation into new habitats. During the Triassic period, the plant community shifted (
Benton 2016
;
Lu et al. 2021
;
Jouault et al. 2022
), and the origin and rise of mammals (
Luo 2007
) and dinosaurs (
Marsicano et al. 2016
) led to a more complex and diverse environment. Increasing the proportion of broad-tuned ORs may increase the ability of insects to recognize a wide range of plant and animal VOCs on the basis of a limited number of OR types, thus providing a greater survival advantage for insects foraging and searching for habitats to achieve rapid occupation of new ecological niches.
Here, we systematically outline the evolutionary origin of the insect OR–Orco olfactory perception model. The ancestral insect recruited GRs to perform olfactory functions, giving rise to the earliest ORs (
Robertson et al. 2003
;
Frank et al. 2024
). These early ORs retained the homologous tetrameric pattern of GRs. However, the sensitivity requirements of olfaction and gustation differ (
de Fouchier et al. 2017
;
Pask et al. 2017
;
Slone et al. 2017
;
Dweck and Carlson 2023
;
Wang et al. 2024
;
Zhao et al. 2024
). This issue appears to have been first address in the ancestor of Zygentoma by reducing the number of functional subunits while maintaining the tetrameric structure, thereby increasing sensitivity (
Brand et al. 2018
;
Thoma et al. 2019
;
Wang et al. 2024
;
Zhao et al. 2024
). We propose that the transition from OR to Orco involved duplication and selection. The number of ORs in
T. domestica
is eight times greater than that in
M. hrabei
, with no direct orthologous relationships, suggesting that OR duplication occurred in the ancestor of
T. domestica
. During Orco selection, at least two essential features were preserved: the β-sheet structure in the EL2 region and the extreme-property binding pocket. The β-sheet physically prevents VOCs from accessing the binding pocket, whereas the chemically restrictive nature of the binding pocket prevents VOCs from penetrating deeply. Orco exhibits strong sequence conservation, ensuring that these chemical and physical barriers are effectively preserved. Sequence similarity is much lower in the insect OR family than in the GR family (
fig. S1A and C
), which may be related to the emergence of Orco. The conserved and stable basal structure of Orco (as a conserved chassis) reduces structural constraints during OR (as a diversified sensor) evolution, allowing ORs to evolve at a faster rate. This strategy represents a unique evolutionary mechanism in the olfactory perception model, where structural conservation of chassis on the basis of Orco enables OR diversification to adapt to complex environments. However, we also identified some ORs with β-sheets in the EL2 region, which may be remnants of early Orco candidates. As insects continued to evolve, the proportion of β-sheet-containing ORs within OR repertoires gradually decreased (
fig. S4G and H
), suggesting that OR evolution is a process of continuous renewal and elimination.
Insect olfaction has undergone evident adaptive evolution in response to lifestyle demands. We found that only larval feeding habits were generally correlated with the theoretical breadth of insect olfactory recognition (
Fig. 5E
), suggesting that, at a macroevolutionary scale, the classification of larval diets plays an important role in shaping the evolutionary trajectory of potential olfactory capacity encoded in the genome. However, this does not imply that the olfactory ability or biological importance of larvae is greater than that of adults. The actual olfactory function at any developmental stage depends on the specific types and expression levels of OR genes, which constitute only a subset of the species’ overall olfactory potential. This is consistent with common sense of biology, as a central objective of insect evolution is to ensure the successful survival of larvae. The larval stage constitutes a significant portion of an insect’s life cycle and is crucial for nutrient accumulation (
Boggs 2009
;
Truman 2019
). For example, insects with saprophagous larvae exhibit broader recognition of amines. Since the odor profile of humus is highly complex, broad-tuned ORs are required to detect a wide range of VOCs, including amines that are rarely found in other food sources (
Hamana and Matsuzaki 1984
;
Hussain et al. 2013
). This indicates that larval saprophagy may have driven the evolutionary shift of species-level olfactory potential toward the recognition of a broader range of VOCs. However, since behaviors such as host recognition and oviposition site selection are carried out by adults, the functional expression of this olfactory potential is likely to occur primarily at the adult stage. Regardless of the developmental stage, we found that hematophagy negatively impacts olfactory potential, likely due to highly specialized diets. Additionally, predatory behavior in adults negatively affects olfactory potential, whereas nectar feeding has a positive effect. Owing to the trade-off between vision and olfaction, predatory insects, such as mantises and dragonflies, have developed excellent vision at the cost of reduced olfactory potential (
Lancer et al. 2020
;
Yuan et al. 2022
;
Kittelmann and McGregor 2024
). These insects rely on strong dynamic tracking abilities, which olfaction alone cannot effectively achieve. In contrast, flowers are stationary and emit distinct, easily identifiable scent profiles, allowing nectar-feeding insects to locate their food sources precisely via olfaction.
In addition to diet, terrestriality has a positive effect on the olfactory breadth of insects. Aquatic insect larvae live in water, where they encounter far fewer VOCs than terrestrial larvae do. Moreover, many aquatic insects do not feed during their adult stage (Data S3), suggesting that their olfactory function may be more related to reproduction rather than foraging. It is widely believed that diurnal species rely primarily on visual cues, whereas nocturnal species prefer to invest in olfaction (
Kaskan et al. 2005
;
Balkenius et al. 2006
;
Campi and Krubitzer 2010
;
Montgomery and Ott 2015
). However, we found that nocturnality has a slight negative effect on the olfactory breadth of insects. This finding does not contradict previous conclusions but rather relates to the trade-off between sensory sensitivity (information collection) and resolution (information processing) (
Stockl et al. 2016a
). Although diurnal moths generally have fewer ommatidia than nocturnal moths do, they possess more visual neuropils, which enhances resolution at the cost of sensitivity (
Stockl et al. 2016a
;
Stockl et al. 2016b
). Similarly, compared with diurnal insects, nocturnal insects allocate a greater proportion of their brain to calyces for olfactory processing (
Stockl et al. 2016a
). As a corresponding trade-off, their olfactory breadth is slightly reduced. In addition, this phenomenon is related to the number of VOC types. High daytime temperatures cause VOCs to be volatile, and a wide range of VOCs needs to be recognized during olfaction, whereas the opposite is true at night (
Menchaca-Torre et al. 2015
;
Monard et al. 2021
). Overall, we systematically explored the relationship between the sequence structure and function of insect ORs, elucidated for the first time, to our knowledge, revealed how insect Orco originated from ORs and identified the key driving factors, and comprehensively explained its adaptive mechanisms to the macroenvironment and lifestyle. This study provides new insights into the ecological factors driving OR evolution at the class scale. With the improvement of genome assemblies, our dataset and similarity-based community classification strategy will serve as valuable resources for future insect OR studies.
Materials and methods
Genome data
We compiled data from all published insect genomes available in the NCBI public database as of December 2022. Genomes with a contig N50 > 1 Mb were considered reliable for OR annotation. When multiple high-quality genomes were available within a single insect family, we selected the genome with the highest assembly quality as the representative. After filtering, 107 insect genomes were included: Odonata (2), Plecoptera (2), Blattodea (1), Hemiptera (6), Psocodea (1), Hymenoptera (22), Megaloptera (1), Neuroptera (1), Coleoptera (14), Trichoptera (7), Lepidoptera (30), and Diptera (20). Detailed genome information is provided in the Data S1. To maximize phylogenetic diversity, we added eight representative species from different orders with annotated ORs (
Machilis hrabei
(
Brand et al. 2018
),
Thermobia domestica
(
Brand et al. 2018
),
Ladona fulva
(
Brand et al. 2018
),
Ephemera danica
(
Brand et al. 2018
),
Locusta migratoria
(
Wang et al. 2015
),
Acyrthosiphon pisum
(
Robertson et al. 2019
),
Acromyrmex echinatior
(
Zhou et al. 2015
), and
Tribolium castaneum
(
RRID:SCR_010440
) (
Engsontia et al. 2008
)). In total, our study includes 115 insect species, covering 16 orders and 111 families.
Species Phylogenies
To construct the phylogenetic tree used in this study, we merged existing phylogenies across different insect orders (
Misof et al. 2014
). For relationships among orders within Insecta, we referred to previously published phylogenetic frameworks. To ensure broad taxonomic representation, we included 16 insect orders in our analysis. Intra-order relationships were obtained from
and other published species trees covering various insect taxa (
Chesters 2017
). For species with available genomes that were not included in existing phylogenies, we inferred their phylogenetic placements based on family-level information. Divergence times among orders were obtained from
(
Kumar et al. 2022
) and calibrated using MCMCtree (
Rannala and Yang 2007
). The resulting phylogeny includes 115 insect species spanning 16 orders.
Ecological Trait Data of Insect Species
Given the vast diversity and ecological complexity of insects, and the lack of a comprehensive authoritative database, we manually retrieved ecological trait data from published literature for each species. We characterized insect ecology based on four aspects: larval diet, adult diet, habitat, and circadian rhythm. For dietary traits, we classified diets into 12 types: herbivorous, xylophagous, hematophagy, mycophagous, non-feeding, omnivorous, predatory, saprovorous, frugivorous, nectarivorous, detritivorous, and parasitic. For habitat, following previous classification criteria, species were assigned as either terrestrial or aquatic (
Dijkstra et al. 2014
). Insects that live entirely or have at least one life stage in water were considered aquatic; those that are strictly land-dwelling throughout their life cycle were considered terrestrial. Circadian rhythm was classified based on adult activity periods as either diurnal or nocturnal. The ecological classification and corresponding literature sources for each species are provided in the Data S3.
OR gene mining and structural filtering
All OR and Orco protein sequences were downloaded from NCBI, supplemented with ORs reported in the paper, yielding a total of 16,176 ORs. Redundancy and data cleaning were then performed using CD-HIT (
Li and Godzik 2006
;
Fu et al. 2012
) v4.8.1 to remove highly similar sequences with >90% identity, resulting in 6,029 non-redundant ORs used as queries. We used Exonerate (
Slater and Birney 2005
) v2.4.0 to search whole-genome data and identify potential exon regions. To improve annotation efficiency, genome contigs were split into 20 Mb segments, with 20 kb flanks added at breakpoints to avoid truncating ORs. Next, InsectOR (
Karpe et al. 2021
) was used for OR gene annotation.
Given that multi-exon gene annotation from genome can be error-prone, we applied the strictest structural filtering strategy to enhance annotation reliability (Fig.S1d). All annotated ORs were modeled using AlphaFold2 (
Jumper et al. 2021
). Structural alignment against the cryo-EM structure of MhOR5 (PDB: 7LIC) was performed using Dali (
Holm 2022
), and ORs with Z-scores <20 were excluded. We further manually removed sequences lacking at least seven transmembrane domains.
In total, 8,912 ORs with complete and credible structural models were retained for downstream analyses. This rigorous approach eliminates structurally compromised ORs that may appear intact at the sequence level, thereby increasing the likelihood of identifying ORs with functional physiological and biochemical properties.
Phylogenetic comparative analyses
The function pGLS of the R package caper was used to perform all phylogenetic generalized linear models presented in this study. Phylogenetic manipulations were conducted using the R packages phytools (
RRID:SCR_015502
) and ape. Phylogenetic trees were visualized by iTOL (
Letunic and Bork 2024
) (
). Animal silhouettes used in this study were retrieved from
.
"Trunk-Branch" strategy
Most existing insect ORs have arisen through gene duplication events (
McKenzie and Kronauer 2018
;
Legan et al. 2021
). Initially, these duplicated OR sequences were highly similar, forming the “trunk” of core communities. Over time, mutations led ORs to diverge from their original sequences and functional features, forming the “branches” of the community (
Fig. 2A
). Based on this “trunk-branch” concept, we developed a strategy to construct similarity networks and define communities and the specific implementation process is as follows:
Communities with more than 20 nodes in the initial-threshold network are defined as core communities (trunks). The initial thresholds were set at e-value = 1e-68 for the SSN and Z-score = 45.9 for the StSN.
Thresholds were gradually relaxed to extend the branches of each core community. Newly appearing nodes were assigned to the community with which they shared the highest number of edges. The SSN threshold was relaxed in logarithmic steps (e.g., 1e-68, 1e-67, …), while the StSN threshold was relaxed in steps of 0.1 Z-score (e.g., 45.9, 45.8, …).
Communities were merged based on their inter-community connectivity. If the proportion of edges connecting two communities exceeded 50% for either community, they were merged. This process was repeated until all inter-community connectivities fell below the 50% threshold.
New communities with more than 20 unassigned nodes were identified and included.
Steps 2–4 was repeated until the network reached a stage of edge explosion and massive community merging.
Previously, final visualization thresholds for sequence similarity networks were often chosen based on known functional annotations. However, such information is lacking for most ORs. We found that under different thresholds, the modularity of community structures defined by the “trunk-branch” strategy showed a sharp inflection point when compared with theoretical modularity derived from the Louvain algorithm. Here, we propose a quantifiable approach for determining the final community display threshold by identifying the inflection point. Validation against known data confirmed that the resulting community partitions are highly reliable.
Sequence similarity network
First, we performed pairwise sequence alignment of all ORs using MMseqs2 (
Steinegger and Soding 2017
) to obtain sequence similarities and e-values. To improve network readability, we applied pre-clustering with CD-HIT (
Li and Godzik 2006
;
Fu et al. 2012
) v4.8.1 (‘-c 0.6 -n 4’) to reduce redundant edges between highly similar nodes, resulting in a total of 4,947 nodes. The edge weight between nodes was defined as the average e-value of all OR pairs they represent. We then constructed the sequence similarity network based on the “trunk-branch” strategy (see "Trunk-Branch Strategy"). An e-value threshold of 1e-25 was ultimately selected as the cutoff for defining the final sequence similarity network and OR subfamilies. At this threshold, 38 OR subfamilies were identified, comprising 8,457 ORs. The network was visualized using the organic layout algorithm in Cytoscape (
Shannon et al. 2003
).
Structure similarity network
We performed structural modeling of all ORs using AlphaFold2 (
Jumper et al. 2021
). Pairwise structural comparisons were then conducted using Dali (
Holm 2022
) to obtain Z-scores. Following an approach similar to that used in SSN, we applied a greedy clustering algorithm to pre-cluster structurally similar ORs at a Z-score threshold of 50, resulting in 3,854 nodes. The edge weight between nodes was defined as the average Z-score of all OR pairs they represent. We then constructed the structure similarity network using the “trunk-branch” strategy. A Z-score threshold of 42.9 was selected as the final cutoff for defining the StSN and OR structural subfamilies. At this threshold, 28 OR structural communities were identified, comprising 7,750 ORs. The network was visualized using the organic layout algorithm in Cytoscape (
Shannon et al. 2003
).
Phylogenetic tree and selection pressure analysis
To infer the amino acid phylogeny of ORs within StrC17, we performed multiple sequence alignment using MAFFT (
Katoh and Standley 2013
) v7.505 with the parameters ‘--globalpair --maxiterate 1000’. The alignments were trimmed using trimAl (
Capella-Gutierrez et al. 2009
) v1.4.rev22 with the parameter ‘-automated1’. A maximum likelihood tree was then constructed using IQ-TREE (
Minh et al. 2013
;
Nguyen et al. 2015
) v 2.2.0 with the parameters ‘-m MFP -B 1000 --bnnì. To estimate dN/dS ratios, we used the codeml program from the PAML package (
RRID:SCR_014932
) (
Yang 1997
;
Yang 2007
). The codeml analysis employed the branch model with the control file parameters set to ‘model = 2’, ‘NSsites = 0’. We used a custom script to extract log-likelihood values (lnL) from the output files and perform likelihood ratio tests (LRTs).
Evaluation of OR binding pocket properties
We used fpocket to identify OR binding pockets and assess their properties, with parameters set to ‘-m 3.1 -i 10’. To locate the centroid region of the binding pocket, we aligned each OR structure to MhOR5 using USalign (
Zhang et al. 2022
) v 20220924. Among all candidate pockets identified by fpocket (
Le Guilloux et al. 2009
) 4.0, the one closest to the centroid was designated as the binding pocket. Due to the stochastic nature of OR modeling, some ORs exhibited open binding pockets, making it difficult to define cavity-related parameters. To ensure consistency in the quantitative analysis, we only included ORs with closed binding pockets. Specifically, we retained only binding pockets with Number of Alpha Spheres < 140 and Volume < 800, excluding any that were open to the exterior.
Molecular dynamics simulation of Orco β-Sheet structural function
We used GROMACS (
Abraham et al. 2015
) to simulate the interaction between the EL2 regions of OR and Orco with VOCs. The proteins used were the cryo-EM structures of ApOrco and ApOR5 (
Wang et al. 2024
) (PDB: 8z9z), and the selected VOC was geranyl acetate (CID: 1549026). The membrane system was rapidly constructed using the QwikMD plugin in VMD (
Humphrey et al. 1996
). After default minimization and annealing steps, an optimized membrane-protein system was obtained. The Caver (
Jurcik et al. 2018
) tool was used to identify the pocket tunnels in the cryo-EM structures of ApisOR5 and ApisOrco. Surface residues were identified using FindSurfaceResidues(
), helping define the residues surrounding the binding pocket. Geranyl acetate was positioned above the pocket, and 5 ns MD simulations were performed to evaluate interactions.
A binding state was considered potential if the following criteria were met:
- The minimum distance between geranyl acetate atoms and pocket residue atoms was <12 Å (cutoff).
- The spatial distribution of the ligand satisfied the following exclusion conditions:
- Not located on the lateral side of the protein
- Not embedded in the phospholipid bilayer
- Not sterically blocked by the EL2 of ApisOrco
Each simulation was repeated 60 times for both ApOrco and ApOR5.
Heterologous expression and calcium imaging
pDmelOR-mRho.V5.mER.hOr47a (
RRID:Addgene_126478
), a high-copy number bidirectional expression vector by inserting
D. melanogaster
Or47a (DmOr47a) and Orco in the pCMV-BI vector (
RRID:Addgene_126475
) backbone (
Miazzi et al. 2019
), was a gift from Bill Hansson (Addgene plasmid # 126478), then V5 tag was replaced with Flag tag, named as pDmelOR-OR47a. The EL2 of OR47a (GHAEPELPFPCLFPWNIHI) in pDmelOR-OR47a was replaced by the EL2 of Orco (GDSVKMVVDHETNSSIPVEIPRLPIKSFYPWNASHG) to constructed the new plasmid of pDmelOR-el2.OR47a. The sequences were confirmed by Sanger sequencing (Sangon Biotech, China).
HEK293T cells (
RRID:CVCL_0063
) were purchased from Wuhan Procell Biotechnology and maintained in DMEM medium (BasalMedia, China) supplemented with 10% fetal bovine serum (ExPhos, China) and 1% penicillin−streptomycin mixture (Sangon Biotech, China) at 37 °C with 5% CO2 until reaching 70–80% confluency. Cells were transfected with plasmids using LipoFiter transfection reagent (Hanbio, China). 6-8h after transfection, transfected cells were seeded at a density of 6 × 10⁵ cells/well into a 35 mm glass-bottom culture dish (NEST, China). The HEK293T(
RRID:CVCL_0063
) cell line used in this study is derived from a male human fetus. HEK293T (
RRID:CVCL_0063
) cells were authenticated by STR profiling (Wuhan Procell) and tested negative for mycoplasma contamination every 3 months.
Cells were harvested for calcium imaging approximately 36 hours post-transfection. The culture medium was removed, and cells were rinsed with HBSS solution (BasalMedia, China). Subsequently, cells were incubated with Fluo-8 AM (5 μM, AAT Bioquest, USA) diluted in HBSS + 0.04% pluronic acid (F127, Sangon Biotech, China) in a CO2 cell culture incubator for 30 minutes at 37°C. Following three washes with HBSS solution, the Ca2+ dependent fluorescence was recorded with a fluorescence microscope (DeltaVision Ultra, GE) with the emission wavelength set at 525 nm and the excitation wavelength at 490 nm. Experiments lasted 5 min with a sampling interval of 5 s. The stimuli—pentyl acetate (PA, 100 μM; Aladdin, China), an OR47a agonist, and VUAA1 (100 μM; Sigma-Aldrich, USA), an Orco agonist—were gently added to the culture dish at 50 s and 180 s, respectively, after the start of the imaging protocol. The recorded signals were analyzed by Fiji (
RRID:SCR_002285
) ImageJ v.1.54 (
RRID:SCR_003070
) (
Schindelin et al. 2012
). Levels of Ca2+ were expressed as ΔF/F0 ratios. The average fluorescence intensity of the cells during the first 30 seconds was recorded as the baseline (F0). Each assay was conducted in triplicate to ensure reproducibility. For calcium imaging experiments, data acquisition and initial AF/F0 ratio calculations were performed by researchers who were blinded to the treatment groups during the analysis phase. Sample sizes for calcium imaging (n = 30) were determined based on common standards in the field and prior pilot experiments to ensure sufficient statistical power for detecting changes in fluorescence intensity
Virtual docking data of ORs and VOCs
We constructed an insect-relevant odorant molecule library from four sources: pheromones (
Li et al. 2023
), food odors (
Chi et al. 2025
), fragrances (
), and theoretical odors (
Mayhew et al. 2022
). This approach ensured ecological relevance and chemical diversity. After deduplication, a total of 14,499 VOCs were retained for downstream analysis. We used Dragon (v.5.4) (
Haddad et al. 2008
) to calculate 32 representative molecular descriptors for each VOC, and the ChemmineR (
Cao et al. 2008
) R package to identify functional groups. VOCs were assigned functional group labels based on group priority rules. Dimensionality reduction of the 32 descriptors was performed using t-SNE, and the resulting two-dimensional odor space was visualized using Matplotlib (
Hunter 2007
). All VOC SMILES were converted to db2 format using the online resource
. OR structures were aligned to the cryo-EM structure of MhOR5 (PDB:7LIC) to estimate the approximate position of the binding pocket. Virtual docking was then performed using DOCK 3.8 (
RRID:SCR_000128
) (
Coleman et al. 2013
), with batch processing handled via custom scripts ‘prepare_dock_file.sh’ and ‘run_dock_paraFly.sh’. In total, we obtained 130 million docking records between ORs and VOCs. This dataset serves as a foundational resource for predicting potential OR functions.
Hit rate curve prediction and maximum hit estimation
To determine the docking score range at which VOCs are likely to exhibit binding activity in electrophysiological assays, we applied Bayesian statistical modeling using prior probability distributions to define the top, midpoint, random hit rate, and slope of the hit rate curve. We assumed that the relationship between docking score (energy, ei) and hit rate follows a dose-response-like curve (
fig. S10A
) (
Lyu et al. 2019
).

This function is defined by four parameters: (1) top: the maximum hit rate; (2) dock50: the docking score at which the hit rate is half of the top value (in kcal mol⁻¹); (3) S: the slope of the curve, calculated as S = slope × 4 / top, where slope is the percentage change in hit rate at dock50 per kcal mol⁻¹; (4) bottom: the minimum hit rate, fixed at 0. To define prior distributions, we analyzed OR hit rates for
Drosophila melanogaster
(
Hallem and Carlson 2006
),
Anopheles gambiae
(
Carey et al. 2010
), and
Spodoptera littoralis
(
de Fouchier et al. 2017
) across eight docking energy intervals and used this empirical data to derive posterior distributions of the model parameters. We specified independent Bayesian priors for each parameter: P(top) ∼ beta (α=20, β= 80), P(dock50) ∼ normal (μ = -10, σ = 15), P(S) ∼ normal (μ = -0.6, σ = 0.1) (
fig. S10B
to D). Sampling from the prior distributions was performed using Hamiltonian Monte Carlo implemented in Stan, with parameters: ‘num_samples = 100000’, ‘num_chains = 4’, ‘num_warmup = 50000’, ‘max_depth = 12’.
Functional similarity network
We first calculated the Pearson correlation coefficients (PCCs) for docking energies between all OR pairs across the VOCs library. ORs were then ranked by the number of small molecules they bind, and a greedy clustering algorithm was applied to pre-cluster ORs with high functional similarity (PCCs ≥ 0.6), resulting in 6,299 nodes. The edge weight between nodes was defined as the average PCC of all OR pairs. The functional similarity network was then constructed using the “trunk-branch” strategy. Due to the complexity of OR functional divergence, our strategy yielded a modularity value that deviated by 0.1 from the theoretical Louvain modularity. To ensure accurate community assignment, we adopted the Louvain algorithm for final community detection. A PCC threshold of 0.48 was selected as the cutoff for defining the final functional similarity network and OR functional communities. The network was visualized using the organic layout algorithm in Cytoscape (
Shannon et al. 2003
).
OR binding breadth to VOCs
We assigned a VOC recognition breadth label to each functional community. First, we counted the number of VOCs with each functional group that were recognized by ORs in each functional community. These counts were then compared against the total number of ORs recognizing that VOCs across all ORs, using Bonferroni-corrected post hoc tests. If a community showed a significantly higher or lower recognition count, it was considered to have distinct recognition capacity for that functional group. The results were normalized by the average VOC count to derive a recognition breadth score for each subfamily.
Based on the functional community labels, we further proposed a metric called binding breadth index (BBI) to quantify the olfactory breadth of a group of ORs toward a particular class of VOCs. To correct for sampling bias caused by small community sizes, we applied the Wilson score interval.
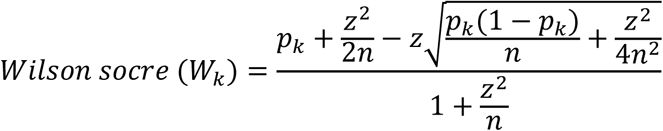
The definitions are as follows: (1) n: total number of ORs in the community; (2) p
k
: proportion of ORs in the k
th
community; (3) z: Z-score for the 95% confidence level (z = 1.96)
The BBI for the i
th
functional group of VOCs is defined as:

Where: (1) W
k
: Wilson score for the k
th
community; (2) F
ki
: the functional label matrix element representing the recognition score of k
th
community for i
th
functional group of VOCs; (3) n: the total number of functional communities (n=6)
This approach provides a statistically robust framework to characterize and compare the olfactory recognition breadth of ORs.
Association between life habits and VOC recognition breadth
We calculated the overall BBI for each species based on combinations of life habits. Using BBI scores across functional groups of VOCs as input features, we performed t-SNE dimensionality reduction, followed by K-means clustering, identifying three major life habit clusters corresponding to high, moderate, and low levels of small-molecule recognition breadth. To further explore the association, we performed binary logistic regression using the R package glmnet, focusing on species in the high and low breadth categories. All life habits were encoded using one-hot encoding, and the dataset was balanced using the ROSE (Random Over Sampling Examples) method to address class imbalance. We split the dataset into training (80%) and testing (20%) sets. The training data underwent 10-fold cross-validation to determine the optimal value of the regularization parameter lambda (
fig. S11A and B
). The model’s performance on the testing set was evaluated using the AUC. Finally, we fit the model using the testing data and the selected optimal lambda value, and extracted the coefficients of the predictor variables, identifying key life habits associated with VOC recognition breadth.
Data availability
The data supporting the findings of this study (Supplementary Data S1-S8) are available for download from the figshare repository at
. All custom scripts and R code used for bioinformatics filtering and similarity network construction are available at GitHub (
) and archived on Zenodo (DOI:
10.5281/zenodo.18459276
).
Acknowledgements
We thank Yuan Huang from Shaanxi Normal University and Chenzhu Wang from the Institute of Zoology, Chinese Academy of Sciences, for their contributions to the early planning of the project. We thank Wenyu Zhang from Northwestern Polytechnical University and Yang Liu from the Chinese Academy of Agricultural Sciences for their suggestions on improving the conceptual framework during the mid-stage of the project. We also thank Hongbo Jiang and Fu Cao from Southwest University for their guidance on the experiments.
Additional information
Author contributions
Conceptualization: H.L., C.X.; Methodology: T.Z., X.Y., Y.F., Y.L.; Investigation: T.Z., X.Y., W.X., H.L., X.Y., Y.Z., S.D., C.G., Y.G.; Visualization: T.Z., X.Y., Y.Y.; Supervision: H.L., C.X., G.L.; Writing—original draft: T.Z., H.L., C.X., G.L.
Funding
We acknowledge the financial support for this work from:
National Natural Science Foundation of China grant nos. 32270525 (H.L.)
National Natural Science Foundation of China grant nos. 32470445 (G.L.)
Innovation Foundation for Doctor Dissertation of Northwestern Polytechnical University grant no. CX2024082 (T.Z.)
Natural Science Basic Research Program of Shaanxi grant no. 2025JC-QYCX-026
(
G.L.
)
Funding
MOST | National Natural Science Foundation of China (NSFC) (32270525)
Huimeng Lu
MOST | National Natural Science Foundation of China (NSFC) (32470445)
Gang Li
Northwestern Polytechnical University (CX2024082)
Tianmin Zhang
陕西省科学技术厅 | Natural Science Basic Research Program of Shaanxi Province (陕西省自然科学基础研) (2025JC-QYCX-026)
Gang Li
Additional files
Supplementary Video 1
References
The Origins of Genome Architecture
Journal of Heredity
98
:633–634
Google Scholar
GROMACS: High performance molecular simulations through multi-level parallelism from laptops to supercomputers
SoftwareX
Google Scholar
Olfactory receptor and circuit evolution promote host specialization
Nature
579
:402–408
PubMed
Google Scholar
Insect odorant receptor trafficking requires calmodulin
BMC Biol
14
:83
PubMed
Google Scholar
The relative importance of olfaction and vision in a diurnal and a nocturnal hawkmoth
J Comp Physiol A Neuroethol Sens Neural Behav Physiol
192
:431–437
PubMed
Google Scholar
Comparative chemosensation from receptors to ecology
Nature
444
:295–301
PubMed
Google Scholar
A novel lineage of candidate pheromone receptors for sex communication in moths
eLife
8
PubMed
Google Scholar
The Triassic
Curr Biol
26
:R1214–R1218
PubMed
Google Scholar
Structural screens identify candidate human homologs of insect chemoreceptors and cryptic Drosophila gustatory receptor-like proteins
eLife
12
PubMed
Google Scholar
Understanding insect life histories and senescence through a resource allocation lens
Functional Ecology
23
:27–37
Google Scholar
Expanding the olfactory code by in silico decoding of odor-receptor chemical space
eLife
2
:e01120
PubMed
Google Scholar
The Evolutionary Dynamics of the Odorant Receptor Gene Family in Corbiculate Bees
Genome Biol Evol
9
:2023–2036
PubMed
Google Scholar
The origin of the odorant receptor gene family in insects
eLife
7
PubMed
Google Scholar
Machine learning decodes chemical features to identify novel agonists of a moth odorant receptor
Sci Rep
10
:1655
PubMed
Google Scholar
Comparative studies of diurnal and nocturnal rodents: differences in lifestyle result in alterations in cortical field size and number
J Comp Neurol
518
:4491–4512
PubMed
Google Scholar
Transposons, Genome Size, and Evolutionary Insights in Animals
Cytogenet Genome Res
147
:217–239
PubMed
Google Scholar
ChemmineR: a compound mining framework for R
Bioinformatics
24
:1733–1734
PubMed
Google Scholar
trimAl: a tool for automated alignment trimming in large-scale phylogenetic analyses
Bioinformatics
25
:1972–1973
PubMed
Google Scholar
Odorant reception in the malaria mosquito Anopheles gambiae
Nature
464
:66–71
PubMed
Google Scholar
Odorant detection in a locust exhibits unusually low redundancy
Curr Biol
33
:5427–5438
PubMed
Google Scholar
Sequence-Based Prediction of Olfactory Receptor Responses
Chem Senses
44
:693–703
PubMed
Google Scholar
Construction of a Species-Level Tree of Life for the Insects and Utility in Taxonomic Profiling
Syst Biol
66
:426–439
PubMed
Google Scholar
Genomic and phenotypic evidence support visual and olfactory shifts in primate evolution
Nat Ecol Evol
PubMed
Google Scholar
The spatial structure of Phanerozoic marine animal diversity
Science
368
:420–424
PubMed
Google Scholar
A novel family of divergent seven-transmembrane proteins: candidate odorant receptors in Drosophila
Neuron
22
:327–338
https://doi.org/10.1016/s0896-6273(00)81093-4
PubMed
Google Scholar
Ligand pose and orientational sampling in molecular docking
PLoS One
8
:e75992
PubMed
Google Scholar
Accelerating Ligand Discovery for Insect Odorant Receptors
Int J Biol Sci
21
:2101–2117
PubMed
Google Scholar
WebLogo: a sequence logo generator
Genome Res
14
:1188–1190
PubMed
Google Scholar
Functional evolution of Lepidoptera olfactory receptors revealed by deorphanization of a moth repertoire
Nat Commun
8
:15709
PubMed
Google Scholar
Evolution at multiple processing levels underlies odor-guided behavior in the genus Drosophila
Curr Biol
33
:4771–4785
PubMed
Google Scholar
Freshwater biodiversity and aquatic insect diversification
Annu Rev Entomol
59
:143–163
PubMed
Google Scholar
Diverse mechanisms of taste coding in Drosophila
Sci Adv
9
:eadj7032
PubMed
Google Scholar
What’s in a genome? The C-value enigma and the evolution of eukaryotic genome content
Philos Trans R Soc Lond B Biol Sci
370
:20140331
PubMed
Google Scholar
The red flour beetle’s large nose: an expanded odorant receptor gene family in Tribolium castaneum
Insect Biochem Mol Biol
38
:387–397
PubMed
Google Scholar
Diversification of the ant odorant receptor gene family and positive selection on candidate cuticular hydrocarbon receptors
BMC Res Notes
8
:380
PubMed
Google Scholar
Structural basis of ligand specificity and channel activation in an insect gustatory receptor
Cell Rep
43
:114035
PubMed
Google Scholar
CD-HIT: accelerated for clustering the next-generation sequencing data
Bioinformatics
28
:3150–3152
PubMed
Google Scholar
Recovery of the Triassic land flora from the end-Permian life crisis
Comptes Rendus Palevol
4
:593–608
Google Scholar
The C-value enigma in plants and animals: a review of parallels and an appeal for partnership
Ann Bot
95
:133–146
PubMed
Google Scholar
Synergy between sequence and size in large-scale genomics
Nat Rev Genet
6
:699–708
PubMed
Google Scholar
Odorant Receptors for Detecting Flowering Plant Cues Are Functionally Conserved across Moths and Butterflies
Mol Biol Evol
38
:1413–1427
PubMed
Google Scholar
A metric for odorant comparison
Nat Methods
5
:425–429
PubMed
Google Scholar
Coding of odors by a receptor repertoire
Cell
125
:143–160
PubMed
Google Scholar
Unusual polyamines in slime molds Physarum polycephalum and Dictyostelium discoideum
J Biochem
95
:1105–1110
PubMed
Google Scholar
Evolution of insect olfaction
Neuron
72
:698–711
PubMed
Google Scholar
Remote homolog detection places insect chemoreceptors in a cryptic protein superfamily spanning the tree of life
Curr Biol
33
:5023–5033
PubMed
Google Scholar
Dali server: structural unification of protein families
Nucleic Acids Res
50
:W210–W215
PubMed
Google Scholar
The Birth and Death of Olfactory Receptor Gene Families in Mammalian Niche Adaptation
Mol Biol Evol
35
:1390–1406
PubMed
Google Scholar
VMD: visual molecular dynamics
J Mol Graph
14
:27–38
https://doi.org/10.1016/0263-7855(96)00018-5
PubMed
Google Scholar
Matplotlib: A 2D Graphics Environment
Computing in Science & Engineering
9
:90–95
Google Scholar
High-affinity olfactory receptor for the death-associated odor cadaverine
Proc Natl Acad Sci U S A
110
:19579–19584
PubMed
Google Scholar
Calmodulin regulates the olfactory performance in Drosophila melanogaster
Sci Rep
11
:3747
PubMed
Google Scholar
Ring-shaped odor coding in the antennal lobe of migratory locusts
Cell
187
:3973–3991
PubMed
Google Scholar
Functional agonism of insect odorant receptor ion channels
Proc Natl Acad Sci U S A
108
:8821–8825
PubMed
Google Scholar
Functional conservation of an insect odorant receptor gene across 250 million years of evolution
Curr Biol
15
:R119–121
PubMed
Google Scholar
Convergent Loss of Chemoreceptors across Independent Origins of Slave-Making in Ants
Mol Biol Evol
39
PubMed
Google Scholar
Multiple drivers and lineage-specific insect extinctions during the Permo-Triassic
Nat Commun
13
:7512
PubMed
Google Scholar
Highly accurate protein structure prediction with AlphaFold
Nature
596
:583–589
PubMed
Google Scholar
CAVER Analyst 2.0: analysis and visualization of channels and tunnels in protein structures and molecular dynamics trajectories
Bioinformatics
34
:3586–3588
PubMed
Google Scholar
InsectOR-Webserver for sensitive identification of insect olfactory receptor genes from non-model genomes
PLoS One
16
:e0245324
PubMed
Google Scholar
Peripheral variability and central constancy in mammalian visual system evolution
Proc Biol Sci
272
:91–100
PubMed
Google Scholar
MAFFT multiple sequence alignment software version 7: improvements in performance and usability
Mol Biol Evol
30
:772–780
PubMed
Google Scholar
Olfactory signalling in vertebrates and insects: differences and commonalities
Nat Rev Neurosci
11
:188–200
PubMed
Google Scholar
Looking across the gap: Understanding the evolution of eyes and vision among insects
Bioessays
46
:e2300240
PubMed
Google Scholar
TimeTree 5: An Expanded Resource for Species Divergence Times
Mol Biol Evol
39
PubMed
Google Scholar
The visual neuroecology of anisoptera
Curr Opin Insect Sci
42
:14–22
PubMed
Google Scholar
Or83b encodes a broadly expressed odorant receptor essential for Drosophila olfaction
Neuron
43
:703–714
PubMed
Google Scholar
Fpocket: an open source platform for ligand pocket detection
BMC Bioinformatics
10
:168
PubMed
Google Scholar
Expansion and Accelerated Evolution of 9-Exon Odorant Receptors in Polistes Paper Wasps
Mol Biol Evol
38
:3832–3846
PubMed
Google Scholar
Interactive Tree of Life (iTOL) v6: recent updates to the phylogenetic tree display and annotation tool
Nucleic Acids Res
52
:W78–W82
PubMed
Google Scholar
iORbase: A database for the prediction of the structures and functions of insect olfactory receptors
Insect Sci
30
:1245–1254
PubMed
Google Scholar
Cd-hit: a fast program for clustering and comparing large sets of protein or nucleotide sequences
Bioinformatics
22
:1658–1659
PubMed
Google Scholar
The grasshopper genome reveals long-term gene content conservation of the X Chromosome and temporal variation in X Chromosome evolution
Genome Res
34
:997–1007
PubMed
Google Scholar
A Chromosome-Level Assembly of Blunt Snout Bream (Megalobrama amblycephala) Genome Reveals an Expansion of Olfactory Receptor Genes in Freshwater Fish
Mol Biol Evol
38
:4238–4251
PubMed
Google Scholar
Volcanically driven lacustrine ecosystem changes during the Carnian Pluvial Episode (Late Triassic)
Proc Natl Acad Sci U S A
118
PubMed
Google Scholar
Transformation and diversification in early mammal evolution
Nature
450
:1011–1019
PubMed
Google Scholar
Ultra-large library docking for discovering new chemotypes
Nature
566
:224–229
PubMed
Google Scholar
The precise temporal calibration of dinosaur origins
Proc Natl Acad Sci U S A
113
:509–513
PubMed
Google Scholar
Transport features predict if a molecule is odorous
Proc Natl Acad Sci U S A
119
:e2116576119
PubMed
Google Scholar
Rapid evolution of smell and taste receptor genes during host specialization in Drosophila sechellia
Proc Natl Acad Sci U S A
104
:4996–5001
PubMed
Google Scholar
Evolution of mosquito preference for humans linked to an odorant receptor
Nature
515
:222–227
PubMed
Google Scholar
Transcriptomics and neuroanatomy of the clonal raider ant implicate an expanded clade of odorant receptors in chemical communication
Proc Natl Acad Sci U S A
113
:14091–14096
PubMed
Google Scholar
The genomic architecture and molecular evolution of ant odorant receptors
Genome Res
28
:1757–1765
PubMed
Google Scholar
Diurnal and seasonal variation of volatile organic compounds in the atmosphere of Monterrey, Mexico
Atmospheric Pollution Research
6
:1073–1081
Google Scholar
Optimization of Insect Odorant Receptor Trafficking and Functional Expression Via Transient Transfection in HEK293 Cells
Chem Senses
44
:673–682
PubMed
Google Scholar
Ultrafast approximation for phylogenetic bootstrap
Mol Biol Evol
30
:1188–1195
PubMed
Google Scholar
Phylogenomics resolves the timing and pattern of insect evolution
Science
346
:763–767
PubMed
Google Scholar
The diversity and evolution of odorant receptors in beetles (Coleoptera)
Insect Mol Biol
29
:77–91
PubMed
Google Scholar
Short-Term Temporal Dynamics of VOC Emissions by Soil Systems in Different Biotopes
Frontiers in Environmental Science
Google Scholar
Brain composition in Godyris zavaleta, a diurnal butterfly, Reflects an increased reliance on olfactory information
J Comp Neurol
523
:869–891
PubMed
Google Scholar
How many species are there on Earth and in the ocean?
PLoS Biol
9
:e1001127
PubMed
Google Scholar
The evolution of animal chemosensory receptor gene repertoires: roles of chance and necessity
Nat Rev Genet
9
:951–963
PubMed
Google Scholar
IQ-TREE: a fast and effective stochastic algorithm for estimating maximum-likelihood phylogenies
Mol Biol Evol
32
:268–274
PubMed
Google Scholar
Evolutionary dynamics of olfactory receptor genes in fishes and tetrapods
Proc Natl Acad Sci U S A
102
:6039–6044
PubMed
Google Scholar
Elucidation of the structural basis for ligand binding and translocation in conserved insect odorant receptor co-receptors
Nat Commun
14
:8182
PubMed
Google Scholar
Specialized odorant receptors in social insects that detect cuticular hydrocarbon cues and candidate pheromones
Nat Commun
8
:297
PubMed
Google Scholar
Diversity and evolution of the vertebrate chemoreceptor gene repertoire
Nat Commun
15
:1421
PubMed
Google Scholar
Inferring speciation times under an episodic molecular clock
Syst Biol
56
:453–466
PubMed
Google Scholar
Tunnel connects lipid bilayer to occluded odorant-binding site of insect olfactory receptor
Biophys Chem
289
:106862
PubMed
Google Scholar
Molecular Evolution of the Major Arthropod Chemoreceptor Gene Families
Annu Rev Entomol
64
:227–242
PubMed
Google Scholar
The chemoreceptors and odorant binding proteins of the soybean and pea aphids
Insect Biochem Mol Biol
105
:69–78
PubMed
Google Scholar
The chemoreceptor superfamily in the honey bee, Apis mellifera: expansion of the odorant, but not gustatory, receptor family
Genome Res
16
:1395–1403
PubMed
Google Scholar
Molecular evolution of the insect chemoreceptor gene superfamily in Drosophila melanogaster
Proc Natl Acad Sci U S A
100
:14537–14542
PubMed
Google Scholar
Insect olfactory receptors are heteromeric ligand-gated ion channels
Nature
452
:1002–1006
PubMed
Google Scholar
Fiji: an open-source platform for biological-image analysis
Nat Meth
9
:676–682
PubMed
Google Scholar
Relaxed selection underlies genome erosion in socially parasitic ant species
Nat Commun
12
:2918
PubMed
Google Scholar
Cytoscape: a software environment for integrated models of biomolecular interaction networks
Genome Res
13
:2498–2504
PubMed
Google Scholar
Complementary function and integrated wiring of the evolutionarily distinct Drosophila olfactory subsystems
J Neurosci
31
:13357–13375
PubMed
Google Scholar
Shifts in bee diet breadths are associated with gene gains and losses and positive selection across olfactory receptors
G3 (Bethesda)
PubMed
Google Scholar
Automated generation of heuristics for biological sequence comparison
BMC Bioinformatics
6
:31
PubMed
Google Scholar
Functional characterization of odorant receptors in the ponerine ant, Harpegnathos saltator
Proc Natl Acad Sci U S A
114
:8586–8591
PubMed
Google Scholar
MMseqs2 enables sensitive protein sequence searching for the analysis of massive data sets
Nat Biotechnol
35
:1026–1028
PubMed
Google Scholar
Differential investment in visual and olfactory brain areas reflects behavioural choices in hawk moths
Sci Rep
6
:26041
PubMed
Google Scholar
Adaptations for nocturnal and diurnal vision in the hawkmoth lamina
J Comp Neurol
524
:160–175
PubMed
Google Scholar
Transcriptome Surveys in Silverfish Suggest a Multistep Origin of the Insect Odorant Receptor Gene Family
Front Ecol Evol
7
:281
Google Scholar
Diversity and Molecular Evolution of Odorant Receptor in Hemipteran Insects
Insects
13
PubMed
Google Scholar
The Evolution of Insect Metamorphosis
Curr Biol
29
:R1252–R1268
PubMed
Google Scholar
End-Permian (252 Mya) deforestation, wildfires and flooding—An ancient biotic crisis with lessons for the present
Earth and Planetary Science Letters
529
:115875
Google Scholar
A spatial map of olfactory receptor expression in the Drosophila antenna
Cell
96
:725–736
https://doi.org/10.1016/s0092-8674(00)80582-6
PubMed
Google Scholar
The locust genome provides insight into swarm formation and long-distance flight
Nat Commun
5
:2957
PubMed
Google Scholar
Structural basis for odorant recognition of the insect odorant receptor OR-Orco heterocomplex
Science
384
:1453–1460
PubMed
Google Scholar
Identification and functional analysis of olfactory receptor family reveal unusual characteristics of the olfactory system in the migratory locust
Cell Mol Life Sci
72
:4429–4443
PubMed
Google Scholar
Functional properties of insect olfactory receptors: ionotropic receptors and odorant receptors
Cell Tissue Res
383
:7–19
PubMed
Google Scholar
Sex Pheromone Receptors of Lepidopteran Insects
Front Ecol Evol
Google Scholar
PAML: a program package for phylogenetic analysis by maximum likelihood
Comput Appl Biosci
13
:555–556
PubMed
Google Scholar
PAML 4: phylogenetic analysis by maximum likelihood
Mol Biol Evol
24
:1586–1591
PubMed
Google Scholar
Genome-Wide Analysis of Odorant and Gustatory Receptors in Six Papilio Butterflies (Lepidoptera: Papilionidae)
Insects
13
PubMed
Google Scholar
The chromosome-level genome of Chinese praying mantis Tenodera sinensis (Mantodea: Mantidae) reveals its biology as a predator
Gigascience
12
PubMed
Google Scholar
Plate tectonic regulation of global marine animal diversity
Proc Natl Acad Sci U S A
114
:5653–5658
PubMed
Google Scholar
US-align: universal structure alignments of proteins, nucleic acids, and macromolecular complexes
Nat Methods
19
:1109–1115
PubMed
Google Scholar
Evolution of olfactory receptor superfamily in bats based on high throughput molecular modelling
Mol Ecol Resour
24
:e13958
PubMed
Google Scholar
Structural basis of odor sensing by insect heteromeric odorant receptors
Science
384
:1460–1467
PubMed
Google Scholar
Chemoreceptor Evolution in Hymenoptera and Its Implications for the Evolution of Eusociality
Genome Biol Evol
7
:2407–2416
PubMed
Google Scholar
Phylogenetic and transcriptomic analysis of chemosensory receptors in a pair of divergent ant species reveals sex-specific signatures of odor coding
PLoS Genet
8
:e1002930
PubMed
Google Scholar
Data from:Evolutionary dynamics of insect odorant receptors reveal ecological tuning shaping olfactory perception
figshare
Code from::Evolutionary dynamics of insect odorant receptors reveal ecological tuning shaping olfactory perception
figshare
Article and author information
Author information
Cite all versions
You can cite all versions using the DOI
10.7554/eLife.110877
. This DOI represents all versions, and will always resolve to the latest one.
Copyright
© 2026,
Zhang et al.
This article is distributed under the terms of the
Creative Commons Attribution License
, which permits unrestricted use and redistribution provided that the original author and source are credited.
Metrics
views
0
downloads
0
citations
0
Views, downloads and citations are aggregated across all versions of this paper published by eLife.


