 五度妙笔
五度妙笔 API商城
API商城
 数据库
数据库The long non-coding RNAis required for optimal ILC2 development
Abstract
Gata3 is an essential transcription factor for the development of several distinct immune cell lineages such as T cells, natural killer (NK) cells, and innate lymphoid cells (ILCs). As such, the levels and timing of
Gata3
expression are critical for directing lineage fate decisions. The
Gata3
locus has a complex and dynamic distal regulatory enhancer landscape. Recently, we identified a non-coding RNA,
Dreg1
, located immediately upstream of the classic +280 kb T/NK cell enhancer (Tce1). To test its function, we excised the
Dreg1
locus in mice and observed a selective reduction of group 2 ILCs (ILC2) across multiple tissues, but mature T, NK, and other ILC lineages remained unchanged. In bone marrow, common innate lymphoid cell progenitors (ILCPs) increased while ILC2 progenitors (ILC2P) decreased, with a modest reduction of
Gata3
in upstream progenitors consistent with an early developmental bottleneck. Chromatin profiling showed the Dreg1 locus is accessible in early lymphoid progenitors and became decorated with H3K27ac in ILCP in a Tcf1-dependent manner. Furthermore, Tcf1-deficient cells did not express
Dreg1
and showed alterations in the epigenetic landscape of the
Dreg1
locus. Finally, we discovered that potential homologues of
Dreg1
harboured in a syntenic enhancer of
GATA3
are also highly expressed in human ILC2. Taken together, we conclude that
Dreg1
is a Tcf1-dependent non-coding RNA critical for fine tuning the high level of
Gata3
required for the optimal development of the ILC2 lineage.
Introduction
The immune system comprises a collection of functionally distinct cell types which act in concert to protect the body from infection and malignancy. These diverse cell populations develop from common haematopoietic progenitors in a highly controlled fashion driven by a network of transcription factors that control lineage-specific gene expression programs. GATA-binding protein 3 (Gata3) is one of the master transcription factors that regulates the development of immune cells such as T cells, Natural Killer (NK) cells, and innate lymphoid cells (ILCs) (
Harly et al., 2018
;
Ho et al., 2009
). Gata3 is also critical for the development of CD4
+
T helper 2 (Th2) cells (
Zheng and Flavell, 1997
) which produce cytokines such as IL4, 5, and 13 that are critical for protection against extracellular pathogens. It has recently emerged that a population of ILCs known as group 2 ILCs (ILC2) with similar characteristics to Th2 cells reside in non-lymphoid tissues such as the small intestine, visceral adipose tissue and lung and have been shown to play a non-redundant role in immunity to helminths and drive allergic immune responses (
Jarick et al., 2022
). ILC2s develop in the bone marrow via common ILC progenitor (CILP) (
Yu et al., 2014
), common helper ILC progenitor (CHILP) (
Klose et al., 2014
), innate lymphoid cell progenitor (ILCP) (
Constantinides et al., 2014
), and, finally, ILC2 progenitor (ILC2P) (
Hoyler et al., 2012
). Gata3 is critical to the development of ILCs (
Hoyler et al., 2012
;
Yagi et al., 2014
), and high levels are required for the development of ILC2P in the bone marrow (
Hoyler et al., 2012
;
Klein Wolterink et al., 2013
).
Dosage of Gata3 plays a critical role in T, NK, and ILC development and peripheral immunity (
Hoyler et al., 2012
;
Klein Wolterink et al., 2013
;
Scripture-Adams et al., 2014
). To support this,
Gata3
expression is spatiotemporally tuned by several distal enhancers that dictate
Gata3
activity in these individual lineages. Previous research identified a 7.1 kb region ~280 kb from the
Gata3
gene that is important for its expression in NK and T cell development, known as T cell enhancer 1 (Tce1) (
Hosoya-Ohmura et al., 2011
;
Ohmura et al., 2016
). Subsequent work found that this region (also termed
Gata3
+278/285) also impacts ILC2 development but not Th2 cell differentiation (
Kasal et al., 2021
). ILC2-specific effects have been attributed to additional distal regulatory regions, such as
Gata3
+674/762 (
Kasal et al., 2021
) and the Gata3 tandem super enhancers (+500/764) (
Furuya et al., 2024
). In addition, a Th2-specific enhancer (
Gata3
+906/935) has recently been identified (
Kumagai et al., 2024
). Overall, this complex regulatory landscape mechanistically fits with a dosage-threshold model controlling
Gata3
expression.
Recently, we discovered a long non-coding RNA gene that we named
Distal regulatory enhancer of Gata3 1 (Dreg1
) which lies ~0.6 kb upstream of Tce1 enhancer (
Chan et al., 2021
;
Chan et al., 2022
). Expression of
Dreg1
is high in early T cell progenitors and Th2 cells, mirroring
Gata3
expression (
Chan et al., 2021
). Overexpression studies indicated that it may be involved in the establishment but not maintenance of
Gata3
expression (
Chan et al., 2021
;
Chan et al., 2022
), but it remains unclear how the loss of
Dreg1
affects immune system development. Here, we explore the role of
Dreg1
in the regulation of immune cell differentiation. We find that deletion of the
Dreg1
locus leads to a specific loss of ILC2 progenitors and their downstream progeny in non-lymphoid tissues but not T or NK cells. Chromatin profiling reveals that the regulatory regions around the
Dreg1
gene are open in haematopoietic progenitors and are bound by the transcription factor TCF1 in early innate lymphoid progenitors and TCF1-deficient mice lack
Dreg1
expression. Finally, we discovered potential homologues of
Dreg1
that are highly expressed in human ILC2 emanating from a syntenic enhancer of GATA3.
Results
Deletion of the
Dreg1
locus results in a specific reduction of ILC2
To understand how
Dreg1
contributes to the development of the immune system, we generated
Dreg1
-deficient mice by CRISPR-Cas9-mediated excision of the complete 3 kb of the
Dreg1
gene (
Figure 1A
). We confirmed that the
Dreg1
gene was removed from the germline and found that these mice reproduced at Mendelian frequencies and exhibited no overt developmental defects suggesting that
Dreg1
is not required for embryogenesis.
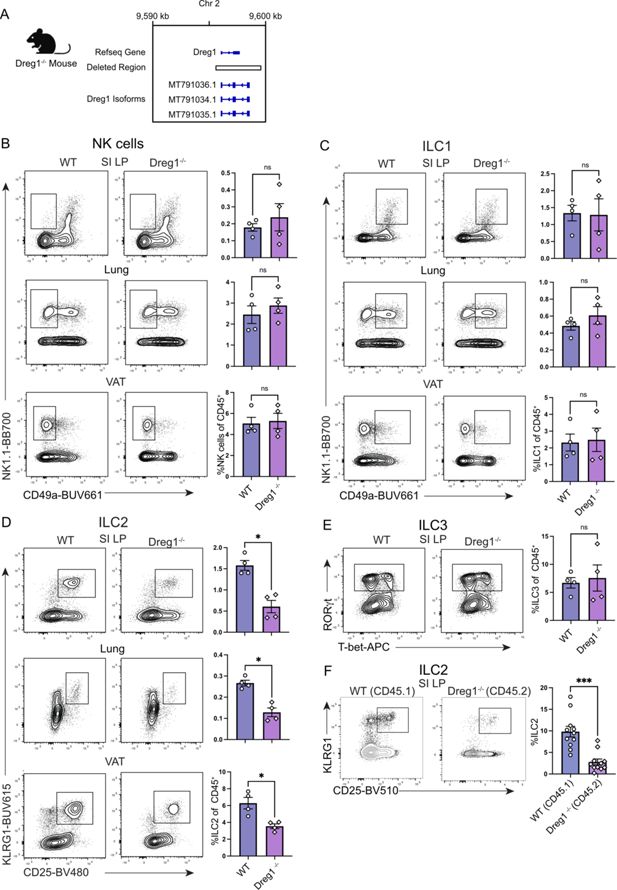
Dreg1
deletion results in a specific reduction in peripheral ILC2 cells.
(
A
) Deletion of Dreg1 in mice using CRISPR-Cas9. (
B–E
) Representative FACS plots and % of CD45
+
, TCRβ
-
, CD19
-
, CD11c
-
NK, and ILC populations from the visceral adipose tissue (VAT), small intestinal lamina propria (SI LP), and lung from wild type (WT) or Dreg1-/- mice. Shown is one representative experiment of two with n=4 mice/group. (
F
) SI LP from mixed bone marrow chimeras were examined for the proportion of ILC2 from the wildtype (CD45.1) or Dreg1-deficient (CD45.2) compartment. Data is pooled from three independent experiments. Mean and SEM together with individual data points are shown. Data were statistically analysed by Student’s
t
-test.
Given our previous finding of the relatively high levels of
Dreg1
expression in T cells (
Chan et al., 2021
), and of a critical role of the Tce1 (
Gata3
+278/285) enhancer (
Hosoya-Ohmura et al., 2011
;
Kasal et al., 2021
), we expected that the deletion of
Dreg1
would impact T cell and NK cell development. We therefore performed an analysis of the different populations of T cells. Mature CD4
+
and CD8
+
T cells in the spleen appeared unaltered in frequency (
Figure 1—figure supplement 1
). Moreover, both populations had similar proportions of naïve, effector, and memory cells (
Figure 1—figure supplement 1B and C
). This suggests that
Dreg1
is not required for conventional T cell development or maintenance. In addition, the loss of
Dreg1
did not affect the development of NK cells and γδ T cells as normal proportions were observed in the spleen (
Figure 1—figure supplement 1D
). Overall, this analysis suggests that
Dreg1
is dispensable for NK and T cell development.
Gata3 is also critical for the development of all innate lymphoid cells (ILCs) (
Yagi et al., 2014
), and the levels of Gata3 are critical in directing ILC2 lineage development (
Hoyler et al., 2012
;
Zhong et al., 2020
). Therefore, we next explored peripheral sites known to harbour substantial numbers of these cell types such as visceral adipose tissue (VAT), the small intestine lamina propria (SI LP), and the lung. While these tissues had relatively normal proportions of NK, ILC1, and ILC3 (
Figure 1B, C and E
), we noted a specific reduction in the population of ILC2 in each of the tissues we examined (
Figure 1D
). Thus far, the data obtained is from mice in which Dreg1 is deleted in all cells, hampering the ability to determine whether the loss of Dreg1 intrinsically regulates ILC2 development or the phenotype is driven by extrinsic signals. To demonstrate a cell-intrinsic role of Dreg1 in ILC2s, we generated mixed bone marrow irradiation chimeras comprising a ratio of 50:50 of wild type (CD45.1
+
) to Dreg1-deficient (CD45.2
+
) cells. In these mice, we observed a reduction in Dreg1-deficient ILC2 in comparison to their wild type ILC2 counterparts in all tissues examined (
Figures 1E–G
). In contrast, we observed comparable proportions of wild type and Dreg1-deficient B cells from these same tissues (
Figure 1—figure supplement 1F and G
). Taken together, these results show that the loss of
Dreg1
results in the specific and intrinsic loss of ILC2 in different peripheral tissues.
Dreg1
deficiency results in the reduction of ILC2 progenitors
We next investigated the origins of the ILC2 defect in the
Dreg1
-deficient mice. It is known that expression of
Gata3
in the early ILC progenitor stage is required for development of mature ILC2s (
Hoyler et al., 2012
;
Klein Wolterink et al., 2013
;
Zhong et al., 2020
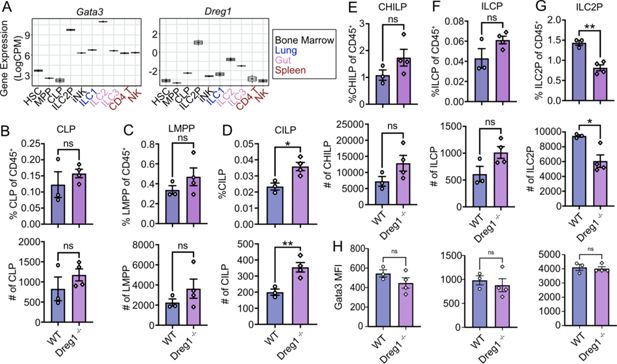
). Indeed, analysis of publicly available RNAseq data
Shih et al., 2016
demonstrated that Gata3 expression was very high in ILC2P and ILC2 compared to other populations, whereas the highest expression of Dreg1 was found in ILC2P (
Figure 2A
). We examined ILC development in the bone marrow (
Figure 2B–G
, gating strategy in
Figure 2—figure supplement 1A
). We began by examining the common lymphoid (CLP) and lymph-myeloid primed progenitors (LMPP) and found no overt changes in proportions or total number of these populations (
Figure 2B and C
). However, we found increased CILP, CHILP and ILCP in the
Dreg1
-deficient mice (reaching significance in the CILPs) (
Figure 2D–F
). We observed a substantial reduction of the ILC2P population suggesting that the loss of
Dreg1
leads to a block in ILC development (
Figure 2G
). This suggests that the loss of
Dreg1
results in a bottleneck at the early stages of ILC development. We next examined the levels of Gata3 in these populations (
Figure 2H
). We observed a reduction in Gata3 signal in the upstream CHILP and the ILCP from the
Dreg1
-deficient mice, but interestingly Gata3 levels were normal in the ILC2P, even though this population is reduced in the
Dreg1
-deficient mice. This suggests that
Dreg1
acts to regulate Gata3 prior to the ILC2P stage which leads to a block in their development; however, if cells can overcome this perturbation, they express relatively normal levels of Gata3.
Dreg1
deletion results in a bottleneck in ILC development and a reduction in ILC2P in the bone marrow.
(
A
) Boxplots showing expression of
Gata3
and
Dreg1
from RNA-Seq (GSE77695). (
B–G
) Quantification of ILC progenitor subsets in the bone marrow with percentages (upper) and total numbers (below). (
H
) Mean fluorescence intensity (MFI) of Gata3 measured on CHILP, ILCP, and ILC2P. Shown is one representative experiment of two with n=3–4 mice/group. Mean and SEM together with individual data points are shown. Data were statistically analysed by Student’s
t
-test.
Dynamic epigenetic regulation of the
Dreg1
locus in a Tcf1-dependent manner during ILC development
To gain a greater understanding of how the expression of
Dreg1
is regulated, we next studied the chromatin state of the
Dreg1
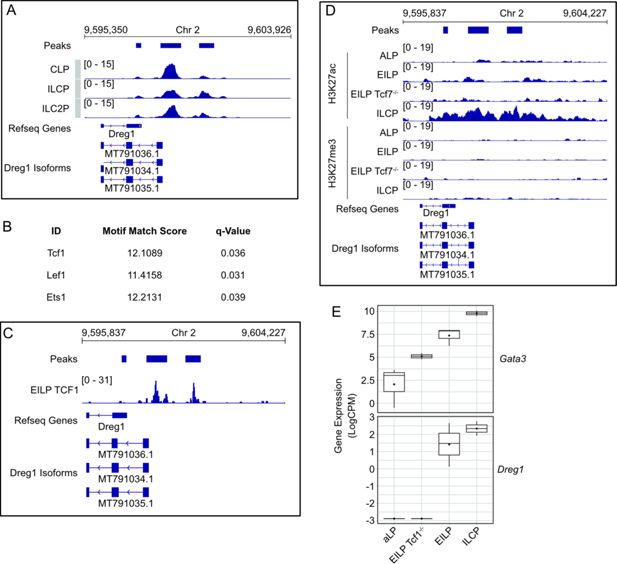
locus during early ILC development via analysis of publicly available ATAC-Seq data generated on progenitors and their downstream ILC progeny (
Kasal et al., 2021
;
Figure 3A
). Of note, the original Refseq annotation of Dreg1 was missing the first exon and TSS which we identified (
Chan et al., 2021
) and show in
Figure 3A
. We observed three significant accessible chromatin ‘peaks’, with the predominant one at the promoter which was open at the CLP stage remained so in ILCP and ILC2P. One region downstream became more accessible in ILCP and ILC2P in line with that observed by others (
Kasal et al., 2021
). Overall, we find the promoter of
Dreg1
is open in early lymphoid progenitors and the acquisition of chromatin accessibility downstream correlates with increased
Dreg1
expression in ILC2 progenitors.
Figure 3
Download asset
Open asset
Dreg1
locus is dynamically regulated in a Tcf1-dependent manner during ILC2 development.
(
A
) Chromatin accessibility around Dreg1 in ILC progenitors (GSE169542). (
B
) Motifs enriched in accessible regions around Dreg1. (
C
) Tcf1 binding around Dreg1 locus in EILP (GSE128483). (
D
) Histone marks around Dreg1 at different stages of ILC development and in Tcf7-/- EILP (GSE142468). (
E
)
Gata3
and
Dreg1
expression quantified from RNA-Seq data in ILC progenitors and Tcf7-/- EILP (GSE113767).
To understand the transcription factors that might be involved in regulating
Dreg1
expression, we examined the motifs at the
Dreg1
promoter and downstream accessible region. We observed a specific enrichment of motifs for Tcf1, Lef1 and Ets1, suggesting that these transcription factors may be involved in regulating
Dreg1
expression. As Tcf1 (encoded by the
Tcf7
gene) has been implicated in ILC2 development (
Mielke et al., 2013
;
Yang et al., 2015
), we focussed on its role in regulating
Dreg1
expression. Firstly, we examined publicly available Tcf1 CUT&Run data (
Harly et al., 2019
) and found that indeed Tcf1 was specifically bound to the accessible sites of the
Dreg1
locus in early innate lymphoid progenitors (EILP, which are a population that sit between CILP and CHILP) (
Figure 3B
). We next examined ChIC-Seq data (
Ren et al., 2022
) of active (H3K27ac) or repressive (H3K27me3) histone modifications at different stages of ILC development (
Figure 3D
). Firstly, we found no evidence of H3K27me3 in this region in any of the cell types examined. However, there was a modest accumulation of H3K27ac around the accessible regions in the
Dreg1
locus at the EILPs which was noticeably increased at the ILCP stage. Of note, Tcf1-deficient (via deletion of the
Tcf7
gene) EILP showed lower levels of H3K27ac, suggesting that Tcf1 is likely involved in creating a permissive chromatin landscape at the
Dreg1
locus during ILC development. Indeed, the expression of
Dreg1
was dependent on the presence of Tcf1 as
Tcf7
-/- EILPs lacked
Dreg1
expression (
Harly et al., 2019
;
Figure 3E
). Taken together, this data suggests that the alterations to the chromatin state
Dreg1
locus and its subsequent transcriptional activity during ILC development is dependent on Tcf1.
Identification of a human GATA3 enhancer harbouring
Dreg1
homologues that are active in ILC2s
Previously, we identified a region syntenic to the mouse
Dreg1
locus on human chromosome 10 that is a similar distance from the
GATA3
gene and forms a 3D interaction in T cells but not B cells, suggesting it may represent an enhancer element (
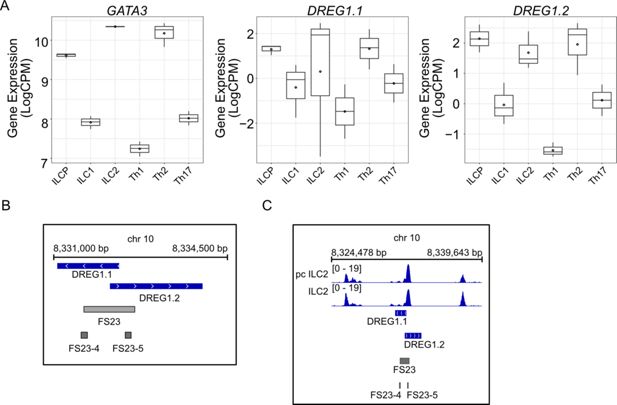
Chan et al., 2021
). Interestingly, bidirectional transcription initiates from the sequence-conserved
cis
element to produce two potential human homologs of
Dreg1
, the lncRNAs CAT00000105356.1 (we named
DREG1.1
) and CAT00000117261.1 (
DREG1.2
). To explore whether these transcripts are also expressed in ILC populations, we examined publicly available RNAseq data from healthy human blood (
Ercolano et al., 2020
;
Figure 4A
). We found that GATA3 was highly expressed in human ILCP, ILC2, and TH2 cells. We also observed this pattern for
DREG1.1
and to an even greater extent for
DREG1.2,
suggesting that the syntenic region harbours transcripts which reflect the same expression pattern as murine
Dreg1
.
Figure 4
Download asset
Open asset
A syntenic region in humans represents a
GATA3
enhancer element with a transcriptional profile akin to murine
Dreg1
.
(
A
)
GATA3
and
DREG1.1 and DREG1.2
expression quantified from RNA-Seq data in ILC and T helper populations isolated from healthy human blood (PRJEB35186). (
B
) Alignment of Functional Sequence 23 (FS23) that overlaps the syntenic region revealed as regulating GATA3 expression in a CRISPR deletion screen of human TH2 cells (
Chen et al., 2023
). (
C
) Chromatin accessibility around FS23 guides from the CRISPR deletion screen (
Chen et al., 2023
) (GSE231999).
Finally, we investigated the functional role of this potential enhancer of GATA3 by examining a recently published tiling CRISPR deletion screen searching for regulatory elements that control GATA3 expression in human Th2 cells (
Chen et al., 2023
). We focused on the syntenic region which was defined as functional sequence (FS) 23 (
Figure 4B
). Specifically, guides that deleted conserved sequences FS23-4 and FS23-5 led to a significant downregulation of GATA3 expression (
Chen et al., 2023
), suggesting that this region represents a distal enhancer of GATA3 (
Figure 4B
). ATACseq data from either cultured (pcILC2) or fresh ILC2 from healthy human blood (
Laurie et al., 2024
) revealed a clear accessible region in these cells that overlaps the
DREG1.1/2
and FS23 (
Figure 4C
). Overall, we find that this syntenic region in humans represents an enhancer that is important for high levels of
GATA3
expression and contains two non-coding RNA genes that show a similar expression pattern to murine
Dreg1
.
Discussion
Here, we show that germline excision of the
Dreg1
locus resulted in a specific reduction in ILC2 cells owing to a developmental bottleneck during ILC development in the bone marrow. These results are in line with the fact that very high levels of Gata3 are required for ILC2 development (
Hoyler et al., 2012
;
Klein Wolterink et al., 2013
). Given its proximity to the Tce1 (+280 kb
Gata3
) enhancer, a surprising finding was that the deletion of
Dreg1
did not affect T or NK cell lineages. While it is tempting to speculate that the
Dreg1
locus represents an ILC2-specific enhancer element, we favour the idea that
Dreg1
likely contributes to dosage tuning of Gata3 during ILC2 commitment and that ILC2s because of their higher Gata3 threshold are more sensitive to modest reductions, whereas T and NK cells are buffered by redundant modules.
Our analysis of publicly available data revealed that the Dreg1 locus was accessible in common lymphoid progenitors and subsequently gained H3K27ac during ILC differentiation coinciding with increased Dreg1 expression. This region was enriched for Tcf1 motifs which was supported by analysis of data from
Harly et al., 2019
, which showed indeed that Tcf1 bound to these regions in ILCP. Subsequent analysis revealed that H3K27ac of the Dreg1 locus and the expression of Dreg1 was reduced in Tcf1-/- EILP. Taken together, this suggests that Tcf1, which is known to be critical for Gata3 expression during ILC development is upstream of, and may act in concert with Dreg1 to promote high levels of Gata3 expression in ILC2 development.
While the analysis of publicly available data was invaluable in providing insights into the regulation of Dreg1, further experiments will dig deeper into the mechanisms utilised by Dreg1 to control Gata3 expression. Indeed, how
Dreg1
is involved in regulating
Gata3
levels mechanistically is yet to be determined.
Dreg1
may act as an enhancer RNA that cooperates with chromatin-modifying proteins (
Statello et al., 2021
) to reinforce local H3K27ac and enhancer–promoter communication. Future experiments that selectively suppress
Dreg1
transcription for example via antisense oligonucleotides or CRISPRi at the Dreg1 promoter will enable the discrimination of RNA-dependent from DNA element-dependent effects.
In humans, we identify two non-coding transcripts within the syntenic GATA3 distal enhancer that are highly expressed in ILCP, ILC2, and TH2 cells. Perturbations within this conserved block in an independent tiling-deletion screen performed by
Chen et al., 2023
resulted in reduced GATA3 expression in T cells. While these experiments were performed in T cells, we expect that this enhancer region will likely also play an important role in the regulation of ILC2 development. Given that ILC2 have been implicated in the development of allergic reactions (
Jarick et al., 2022
), the non-coding transcripts we identified may represent targets for the modulation of GATA3 levels and ILC2 function in disease.
Methods
Mice
The
Dreg1
knockout mouse line was generated at the Melbourne Advanced Genome Editing Centre (MAGEC) laboratory using CRISPR-Cas9 through microinjection into the pronucleus of one-cell stage C57BL/6 embryos with two sgRNAs (
CTACTTGCTGACAAGTCGTC
and
TCTAGTAAGTCCAGTTGCTT
) to target the 3594 bp genomic region around
Dreg1
. The F0 offspring were validated for
Dreg1
deletion with forward primer
GACCAGATATGGAGACGTGCA
and reverse primer
TCTTTGCCATCTTCTGTGTGC
and were backcrossed with wild-type C57BL6/J mice for two or more generations.
Cells and tissues were obtained from littermate control mice aged at least 6 weeks unless otherwise specified. Due to sex differences in ILC populations (
Kadel et al., 2018
), only female mice were used. All mice were maintained at the WEHI Animal Facility under specific pathogen-free conditions. All experiments were approved by The Walter and Eliza Hall Institute Animal Ethics Committee (#2018.002, #2022.002 and #2022.034). Animals were assigned to experimental groups using simple randomisation. Data were statistically analysed by Student’s
t
-test using GraphPad Prism, with p<0.05 considered significant.
Bone marrow chimeras
Mixed bone marrow chimeras were generated by harvesting bone marrow from either wild type (CD45.1
+
) mice or Dreg1-deficient (CD45.2
+
) mice, mixing equally and injecting 5 million cells intravenously into lethally irradiated (2 × 550 Gy) F1 (CD45.1
+
/CD45.2
+
) mice. Mice were left to reconstitute for over 8 weeks.
Cell isolation
Thymus and spleen
The spleen and thymus were made into single-cell suspension by mashing through a 70 µm mesh. Splenic cells were treated with red cell lysis buffer.
Bone marrow
Both pairs of hips, femurs, and tibia bones were grounded in a mortar and pestle to collect the bone marrow. The cell suspension was filtered through a 70 µm cell strainer and negatively enriched for ILC cells with the mouse lineage cell depletion kit (Miltenyi).
Extraction of lymphocytes from non-lymphoid tissues
Lymphocytes from the VAT and lung were finely chopped in 3–5 mL digestion buffer (RPMI and 2% FCS with 2 mg/mL Collagenase IV). The suspension was digested for 40 min at 37°C and shaken at 180 rpm. Digested VAT samples were topped up to 30 mL with FACS buffer (1× PBS with 2% FCS) and spun at 800 ×
g
for 15 min at 4°C. Lungs were mashed through a 70 mM filter and topped to 30 mL FACS buffer and pelleted at 1700 rpm for 5 min. Both VAT and lung pellets were treated with RBC lysis buffer.
Isolation of lymphocytes from small intestinal lamina propria
Mesentery and Peyer’s patches were removed longitudinally, and faeces removed. Intestine was chopped into 0.5 cm pieces into 1× PBS and vortexed. Intestinal pieces were placed into 20 mL of dissociation buffer (1× HBSS without Ca
2+
and Mg
2+
with 2% FCS, 10 mM HEPES and 5 mM EDTA) and digested for 40 min at 37°C at 180 rpm. Digested pieces were washed with FACS buffer and then placed in 5–8 mL of digestion buffer (1× HBSS with indicator containing 2% FCS, 10 mM HEPES, 2 mg/mL Collagenase IV, and 2 mg/mL DNAse I) and incubated for 30–40 min at 37°C at 180 rpm. Digested tissue was mashed through a 70 mM cell strainer and pelleted. A 40/80% percoll gradient was performed to enrich for lymphocytes.
Flow cytometry and antibodies
Fluorophore conjugated antibodies against mouse antigens were used for flow cytometry. Antibodies, clone names, and manufacturers:
Biolegend
: CD4 (GK1.5) APCFire750, CD8a (53–6.7) BV570, NKp46 (29A1.4) PEcy7, ICOS (7E.17G9) BV421, Ki67 (11F6) BV650, CD62L (MEL-14) APC and T-bet (4B10) APC.
BD
: CD19 (1D3) BV786, TCRb (H57-597) BV750, TCRgd (GL3) BV711, B220 (RA3-6B2) BV786, GATA3 (L50-823) BUV395, RORgt (Q31-378) BV421, RORgt (Q31-378) PerCPcy5.5, KLRG1 (2F1) BUV615, CD49a (Ha31/8), CD25 (PC61) BV480, NK1.1 (PK136) BUV805, NK1.1 (PK136) BB700, CD44 (IM7) BUV496.
Invitrogen/Bioscience
: CD11c (N418) FITC, FOXP3 (FJK-16s) PE, IL-33R (ST2) (RMST2-2) PerCP-eFLuor710, Streptavidin BUV563.
WEHI
: CD45.2 (104) AF700. Live dead staining was performed using Fixable viability stain 440UV diluted in 1xPB at 1:1000 dilution. Surface staining of antibodies was for 30 min on ice at 1/200, 1/300 or 1/400 in FACS buffer. Intracellular staining of transcription factors was overnight at 4°C using the Foxp3/Transcription factor staining buffer set from eBioscience overnight. Cell numbers for specific cell populations were calculated using the volume of the sample that was analysed, the cell counts per sample, and the percentage of the specific cell population.
RNA-Seq analysis
Publicly available RNA-Seq data were downloaded from SRA and re-analysed. Briefly fastq files were analysed with FASTQC (0.12.1) and adapters were removed using trimmomatic (
Bolger et al., 2014
) (0.36). The reads were aligned to GRCm39 for mouse samples and GRCh38 for human samples using hisat2 (
Kim et al., 2019
) (2.0.5). Gene counts were quantified using Rsubread (
Liao et al., 2019
) featureCounts (1.6.3) with annotation from gencode (
Mudge et al., 2025
) (vM33 for mouse and v42 for human), which had the annotation for the
Dreg1
gene or human homologs of the
Dreg1
gene added, respectively. Samples were processed using edgeR (
Robinson et al., 2010
) (3.42.4). Lowly expressed genes were removed, and samples were normalised according to library size. Gene expression was plotted as logCPM using ggplot2 (3.4.4).
ATAC-Seq analysis
Publicly available ATAC-Seq data were downloaded from SRA and re-analysed. Processing was based on the ENCODE ATAC-Seq pipeline. Briefly fastq files were analysed with FASTQC and adapters were removed using trimmomatic (0.36). The reads were aligned to the GRCm39 genome for mouse samples and GRCh38 genome for human samples using bowtie2 (2.4.4). Duplicate reads were marked using Picard tools (2.26.11) and reads were filtered using samtools (
Danecek et al., 2021
) (1.9) with -F 1804 -f 2. Fold-change coverage tracks were created using macs2 () callpeak with a smooth window of 150 and a shift size of –75 and bdgcmp. The bedgraph was converted to a bigwig using ucsc tools (331) bedGraphToBigWig (
Kent et al., 2010
) and visualised using IGV (
Thorvaldsdóttir et al., 2013
) (2.17.4) with group scaling among samples from the same experiment.
Motif scanning
The regions of interest as identified through peak calling of ATAC-Seq data were scanned for motifs using FIMO (
Grant et al., 2011
) from the MEME suite (5.0.5) using the Hocomoco (
Kulakovskiy et al., 2018
) (H12) core motif database. The resulting list was filtered to remove factors that were not expressed in ILC2P cells as determined through bulk RNA-Seq (GSE77695) with a cutoff of ≥ 1 LogCPM.
ChIC and CUT&Run analysis
Publicly available ChIP-Seq or CUT&Run data were downloaded from SRA and re-analysed. Briefly fastq files were analysed with FASTQC and adapters were removed using trimmomatic (0.36). The reads were aligned to the GRCm39 genome for mouse samples using bowtie2 (2.4.4) with the options -q –5 0–3 0. Duplicate reads were marked using Picard tools (2.26.11) and reads were filtered using samtools (1.9) with -F 1804 -f 2. Fold-change coverage tracks were created using macs2 () callpeak with a smooth window of 50 and a shift size of –25 for transcription factors and 150 and –75 for histone marks along with macs2 bdgcmp. The bedgraph was converted to a bigwig using ucsc tools (331) bedGraphToBigWig and visualised using IGV (2.17.4) with group scaling among samples from the same experiment.
CRISPR guides
The guide counts were downloaded from GSE190860 and were used to create a bed file to identify the target regions. The bed file was visualised in IGV (2.17.4).
Publicly available datasets used in this study
Dataset type | Accession number |
|---|---|
Bulk RNA-Seq (Mouse-ILC) ( Shih et al., 2016 ) | GSE77695 |
Bulk RNA-Seq (Mouse-ILC w TCF1KO) ( Harly et al., 2019 ) | GSE113767 |
Bulk RNA-Seq (Human) ( Ercolano et al., 2020 ) | PRJEB35186 |
Bulk ATAC-Seq (ILCP) ( Kasal et al., 2021 ) | GSE169542 |
Bulk ATAC-Seq (HumanMouseILC2) ( Laurie et al., 2024 ) | GSE231999 |
Bulk ChIP-Seq (Histone) ( Gury-BenAri et al., 2016 ) | GSE85156 |
Bulk CUT&Run (EILP TCF1) ( Harly et al., 2019 ) | GSE128483 |
Bulk ChIC-Seq (Histone Tcf1 KO) ( Ren et al., 2022 ) | GSE142468 |
CRISPR Screen ( Chen et al., 2023 ) | GSE190860 |
Data availability
No new datasets were produced in this study. Source data for Figures 1 and 2 has been provided in
Source data 1
.
References
Trimmomatic: a flexible trimmer for Illumina sequence data
Bioinformatics
30
:2114–2120.
PubMed
Google Scholar
Identification and characterization of the long noncoding RNA Dreg1 as a novel regulator of Gata3
Immunology and Cell Biology
99
:323–332.
PubMed
Google Scholar
Activation of stably silenced genes by recruitment of a synthetic de-methylating module
Nature Communications
13
:5582.
PubMed
Google Scholar
Deletion mapping of regulatory elements for GATA3 in T cells reveals a distal enhancer involved in allergic diseases
American Journal of Human Genetics
110
:703–714.
PubMed
Google Scholar
A committed precursor to innate lymphoid cells
Nature
508
:397–401.
PubMed
Google Scholar
Twelve years of SAMtools and BCFtools
GigaScience
10
:giab008.
PubMed
Google Scholar
Distinct and shared gene expression for human innate versus adaptive helper lymphoid cells
Journal of Leukocyte Biology
108
:723–737.
PubMed
Google Scholar
Stage-specific GATA3 induction promotes ILC2 development after lineage commitment
Nature Communications
15
:5610.
PubMed
Google Scholar
FIMO: scanning for occurrences of a given motif
Bioinformatics
27
:1017–1018.
PubMed
Google Scholar
The spectrum and regulatory landscape of intestinal innate lymphoid cells are shaped by the microbiome
Cell
166
:1231–1246.
PubMed
Google Scholar
Development and differentiation of early innate lymphoid progenitors
The Journal of Experimental Medicine
215
:249–262.
PubMed
Google Scholar
The transcription factor TCF-1 enforces commitment to the innate lymphoid cell lineage
Nature Immunology
20
:1150–1160.
PubMed
Google Scholar
GATA3 and the T-cell lineage: essential functions before and after T-helper-2-cell differentiation
Nature Reviews. Immunology
9
:125–135.
PubMed
Google Scholar
An NK and T cell enhancer lies 280 kilobase pairs 3’ to the gata3 structural gene
Molecular and Cellular Biology
31
:1894–1904.
PubMed
Google Scholar
The transcription factor GATA-3 controls cell fate and maintenance of type 2 innate lymphoid cells
Immunity
37
:634–648.
PubMed
Google Scholar
Non-redundant functions of group 2 innate lymphoid cells
Nature
611
:794–800.
PubMed
Google Scholar
A major population of functional KLRG1
-
ILC2s in female lungs contributes to a sex bias in ILC2 numbers
ImmunoHorizons
2
:74–86.
PubMed
Google Scholar
A
Gata3
enhancer necessary for ILC2 development and function
PNAS
118
:e2106311118.
Google Scholar
BigWig and BigBed: enabling browsing of large distributed datasets
Bioinformatics
26
:2204–2207.
PubMed
Google Scholar
Graph-based genome alignment and genotyping with HISAT2 and HISAT-genotype
Nature Biotechnology
37
:907–915.
PubMed
Google Scholar
Essential, dose-dependent role for the transcription factor Gata3 in the development of IL-5+ and IL-13+ type 2 innate lymphoid cells
PNAS
110
:10240–10245.
PubMed
Google Scholar
Differentiation of type 1 ILCs from a common progenitor to all helper-like innate lymphoid cell lineages
Cell
157
:340–356.
PubMed
Google Scholar
HOCOMOCO: towards a complete collection of transcription factor binding models for human and mouse via large-scale ChIP-Seq analysis
Nucleic Acids Research
46
:D252–D259.
PubMed
Google Scholar
A distal enhancer of GATA3 regulates Th2 differentiation and allergic inflammation
PNAS
121
:e2320727121.
PubMed
Google Scholar
Type II innate lymphoid cell plasticity contributes to impaired reconstitution after allogeneic hematopoietic stem cell transplantation
Nature Communications
15
:6000.
PubMed
Google Scholar
The R package Rsubread is easier, faster, cheaper and better for alignment and quantification of RNA sequencing reads
Nucleic Acids Research
47
:e47.
Google Scholar
TCF-1 controls ILC2 and NKp46+RORγt+ innate lymphocyte differentiation and protection in intestinal inflammation
Journal of Immunology
191
:4383–4391.
PubMed
Google Scholar
GENCODE 2025: reference gene annotation for human and mouse
Nucleic Acids Research
53
:D966–D975.
PubMed
Google Scholar
Lineage-affiliated transcription factors bind the Gata3 Tce1 enhancer to mediate lineage-specific programs
The Journal of Clinical Investigation
126
:865–878.
PubMed
Google Scholar
Transcription factors TCF-1 and GATA3 are key factors for the epigenetic priming of early innate lymphoid progenitors toward distinct cell fates
Immunity
55
:1402–1413.
PubMed
Google Scholar
edgeR: a Bioconductor package for differential expression analysis of digital gene expression data
Bioinformatics
26
:139–140.
PubMed
Google Scholar
GATA-3 dose-dependent checkpoints in early T cell commitment
Journal of Immunology
193
:3470–3491.
PubMed
Google Scholar
Developmental acquisition of regulomes underlies innate lymphoid cell functionality
Cell
165
:1120–1133.
PubMed
Google Scholar
Gene regulation by long non-coding RNAs and its biological functions
Nature Reviews. Molecular Cell Biology
22
:96–118.
PubMed
Google Scholar
Integrative Genomics Viewer (IGV): high-performance genomics data visualization and exploration
Briefings in Bioinformatics
14
:178–192.
PubMed
Google Scholar
The transcription factor GATA3 is critical for the development of all IL-7Rα-expressing innate lymphoid cells
Immunity
40
:378–388.
PubMed
Google Scholar
TCF-1 upregulation identifies early innate lymphoid progenitors in the bone marrow
Nature Immunology
16
:1044–1050.
PubMed
Google Scholar
The basic leucine zipper transcription factor NFIL3 directs the development of a common innate lymphoid cell precursor
eLife
3
:e04406.
PubMed
Google Scholar
The transcription factor GATA-3 is necessary and sufficient for Th2 cytokine gene expression in CD4 T cells
Cell
89
:587–596.
https://doi.org/10.1016/s0092-8674(00)80240-8
PubMed
Google Scholar
Differential expression of the transcription factor GATA3 specifies lineage and functions of innate lymphoid cells
Immunity
52
:83–95.
PubMed
Google Scholar
Article and author information
Author details
Sara Quon

"This ORCID iD identifies the author of this article:"
0000-0003-3860-3491
Funding
National Health and Medical Research Council (2001131)
Rhys Allan
Stafford Fox Medical Research Foundation
Rhys Allan
National Health and Medical Research Council (2009336)
Ajithkumar Vasanthakumar
The funders had no role in study design, data collection and interpretation, or the decision to submit the work for publication.
Acknowledgements
We thank the members of the Allan and Vasanthakumar labs for their input into this project. The authors also gratefully acknowledge the WEHI Flow Cytometry and Bioservices Facilities for their support and assistance in this work. We also thank the Melbourne Advanced Genome Editing Centre (MAGEC) laboratory for generation of the Dreg1
-/-
349 mice. Funding This work was supported by the NHMRC, Australia Ideas Grant 2001131 and a Stafford Fox Medical Foundation Research Grant to RA and an NHMRC Investigator Grant 2009336 to AV. This work was made possible through Victorian State Government Operational Support Program and the Australian Government NHMRC IRIISS.
Ethics
All experiments were approved by The Walter and Eliza Hall Institute Animal Ethics Committee (#2018.002, #2022.002 and #2022.034).
Version history
Preprint posted
:
Sent for peer review:
Reviewed Preprint version 1
:
Reviewed Preprint version 2
:
Version of Record published
:
Cite all versions
You can cite all versions using the DOI
. This DOI represents all versions, and will always resolve to the latest one.
Copyright
© 2026, Quon, Tang et al.
This article is distributed under the terms of the
Creative Commons Attribution License
, which permits unrestricted use and redistribution provided that the original author and source are credited.
Metrics
427
views
15
downloads
0
citations
Views, downloads and citations are aggregated across all versions of this paper published by eLife.
Download links
A two-part list of links to download the article, or parts of the article, in various formats.
Downloads
(link to download the article as PDF)
Article PDF
Figures PDF
Open citations
(links to open the citations from this article in various online reference manager services)
Mendeley
Cite this article
(links to download the citations from this article in formats compatible with various reference manager tools)
The long non-coding RNA
Dreg1
is required for optimal ILC2 development
eLife
15
:RP109408.


