
 五度妙笔
五度妙笔 企业透视镜
企业透视镜 API商城
API商城
 数据库
数据库Brawn before bite in endemic Asian mammals after the end-Cretaceous extinction
Abstract
The first 10 million years (Myr) following the Cretaceous-Paleogene (K-Pg) mass extinction marked a period of global greenhouse conditions and dramatic rise of placental mammals. Because ∼80% of known terrestrial sections capturing post-K-Pg mammal recovery come from North America, a substantial knowledge gap exists in the tempo and mode of recovery in Asia, where only 3% of global sites are located and most contain species found nowhere else. We show that isolated Paleocene placental assemblages from China (1) exhibited high mean tooth size and disparity early in the Paleocene, (2) shifted in their dental shape in parallel with regional and global environmental changes later in the Paleocene, and (3) achieved maximum dental shape-performance covariation near the end of the first 10 Myr post-K-Pg. This ‘brawn before bite’ transformation, coupled with prolonged dental shape versus performance variability, favors a scenario whereby many living orders of placental mammals were borne out of phenotypically and functionally plastic ancestral assemblages, including those in tropical south China, during the Paleocene.
Main Text
The Cretaceous-Paleogene (K-Pg) mass extinctions accelerated the formation of modern-day global biota. In particular, the more than 6,000 species of living placental mammals trace their origins to the diversification of major orders around or after the K-Pg boundary
1
–
3
. Different hypotheses (for example: early rise, suppression, and late rise) about the timing of their adaptive radiation have been proposed
1
,
4
,
5
. Regardless of the diversification scenarios favored by the competing explanations, the Paleocene epoch (66-56 Myr ago) has been highlighted as among the most critical time interval for establishing the macroevolutionary parameters of the placental adaptive radiation
6
,
7
(but see
5
). However, substantial asymmetry exists in the quantity and quality of terrestrial fossil records that document the first 10 Myr of the ‘Age of Mammals’, with ∼80% of known terrestrial K-Pg boundary sections worldwide occurring in North America
8
. Earliest Paleocene mammals are not known from Europe
9
,
10
, rendering detailed reconstructions of post-K-Pg recovery in that continent difficult. The post-K-Pg fossil assemblages from Asia have hitherto not been considered in analyses of post-K-Pg recovery dynamics
11
.
The North American fossil record suggests that post-K-Pg mammal taxonomic diversity recovery was relatively rapid; most occurred within the first ∼0.3 to 1 Myr of the Paleocene epoch
12
–
17
. This initial placental mammal diversification was driven by archaic groups (i.e., stem placental/eutherian lineages and extinct placental subgroups), followed by the first appearance of many modern orders during two peak hyperthermal events in the past 66 Myr, at the end-Paleocene and early Eocene climatic maxima, respectively
18
,
19
.
Distinct from these taxonomic recovery patterns, high selectivity of mammalian ecomorphological extinction across the K-Pg boundary indicates a primary productivity filter at the start of the Cenozoic Era (66 Myr ago to the present)
20
. Additionally, the first 10 Myr of mammalian brain evolution after the K-Pg was marked by niche partitioning along a size gradient; endocranial traits reflecting more complex sensory processing did not appear until the Eocene (56 Myr ago). This phenomenon has been termed the ‘brawn before brains’ hypothesis
21
. A similar pattern in initial size-driven diversification followed by expansion of ecomorphological disparity is also observed in mammal jaws, indicating a general dynamic across phenotypic systems
22
. Whether this mode of evolution, whereby size disparity increase precedes other ecomorphological traits, should be understood as a global phenomenon during the post-K-Pg placental radiation remains untested, in large part because no such analyses have centered on non-North American continental fossil mammal records.
A major challenge with expanding analyses of post K-Pg recovery to Paleocene mammal assemblages elsewhere in the world is the stratigraphically limited nature of early Cenozoic sequences that produce fossil mammals. In Asia, Paleocene localities in China represent the best studied to date
11
. From the earliest Paleocene, highly regional and endemic faunas are known from a handful of sedimentary basins (
Fig. S1A
). Among the recorded faunal elements, only the archaic placental clades Anagalida and Pantodonta are consistently sampled across the major subdivisions of the Paleocene
11
. An additional complication with ecomorphological analysis of these early mammals is the uncertainty in their dietary ecology, as they are beyond the reach of conventional phylogenetic bracketing approaches to dietary reconstruction. Phenomic analysis of the placental radiation supports insectivory as the ancestral diet of the hypothetical placental ancestor, but uncertainty in the post K-Pg availability of insects and plants in some regions leave some doubt as to the accuracy and scope of this ancestral state reconstruction
1
. Herein we treat the archaic Paleocene taxa in our analyses as having uncharacterized diets rather than categorizing them as insectivores, herbivores, or carnivores.
We investigated dental topography-performance shifts and timing of ecomorphological diversification by developing and leveraging the largest dataset to date of Paleocene Asian mammal assemblages. Our analyses focused on placental mammals from three of the most fossiliferous and biogeographically isolated Paleocene sedimentary sequences in paleotropical Asia: The Nanxiong, Qianshan, and Chijiang Basins in present-day south China
23
–
27
(
Fig. S1
). We generated a new phenotypic dataset of 200 Asian Paleocene mammal teeth using high-resolution microcomputed tomography and laser scanning, capturing 37 species endemic to low-latitude east Asia and which are brought to bear on K-Pg recovery dynamics for the first time (Data S1-S2). Teeth are among the most well-preserved parts of fossil mammals, and the fact that they interface directly with the environment through mastication makes them suitable elements for studying potential ecology-morphology linkages. We used dental topographical traits as indicators of ecomorphological diversity
28
and examined temporal shifts in tooth crown complexity, curvature, and height. We additionally assessed the association of topographical traits with tooth crown mechanical performance in terms of deformation resistance using topographic and simulation analyses. Our dataset spans the Paleocene, the first 10 Myr of the Cenozoic, enabling us to test the hypothesis that dental topography and tooth puncturing and shearing performance linkages showed delayed niche expansion relative to mean body size and size disparity during this initial period of post-K-Pg mammal recovery in Asia.
Dental traits paralleled Paleocene global and regional environmental conditions
We found that dental topographic trait variability in Paleocene mammals in south China tracked global and regional climatic changes despite stasis in high-level taxonomic composition over the course of the first 10 Myr after the K-Pg transition (
Fig. 1
). Dental height and sharpness variability were low in the beginning and end of the time interval, with a peak in the middle Paleocene. This pattern is observed both when dentitions are considered as pooled samples through time, and particularly driven by the lower dentition (
Fig. S5
; note that upper teeth display the opposite pattern). In contrast, elevated low-level taxonomic turnover of genera and species within the Paleocene indicates cladogenetic shifts, rather than anagenetic adaptation, underpin this dental topographic evolution (Data S1)
11
. These findings suggest that in addition to its impact on crown group mammals, the K-Pg extinctions and subsequent climatic fluctuations played a role in filtering out archaic placental mammals with lower speciation rates in favor of rapidly speciating taxa
29
.
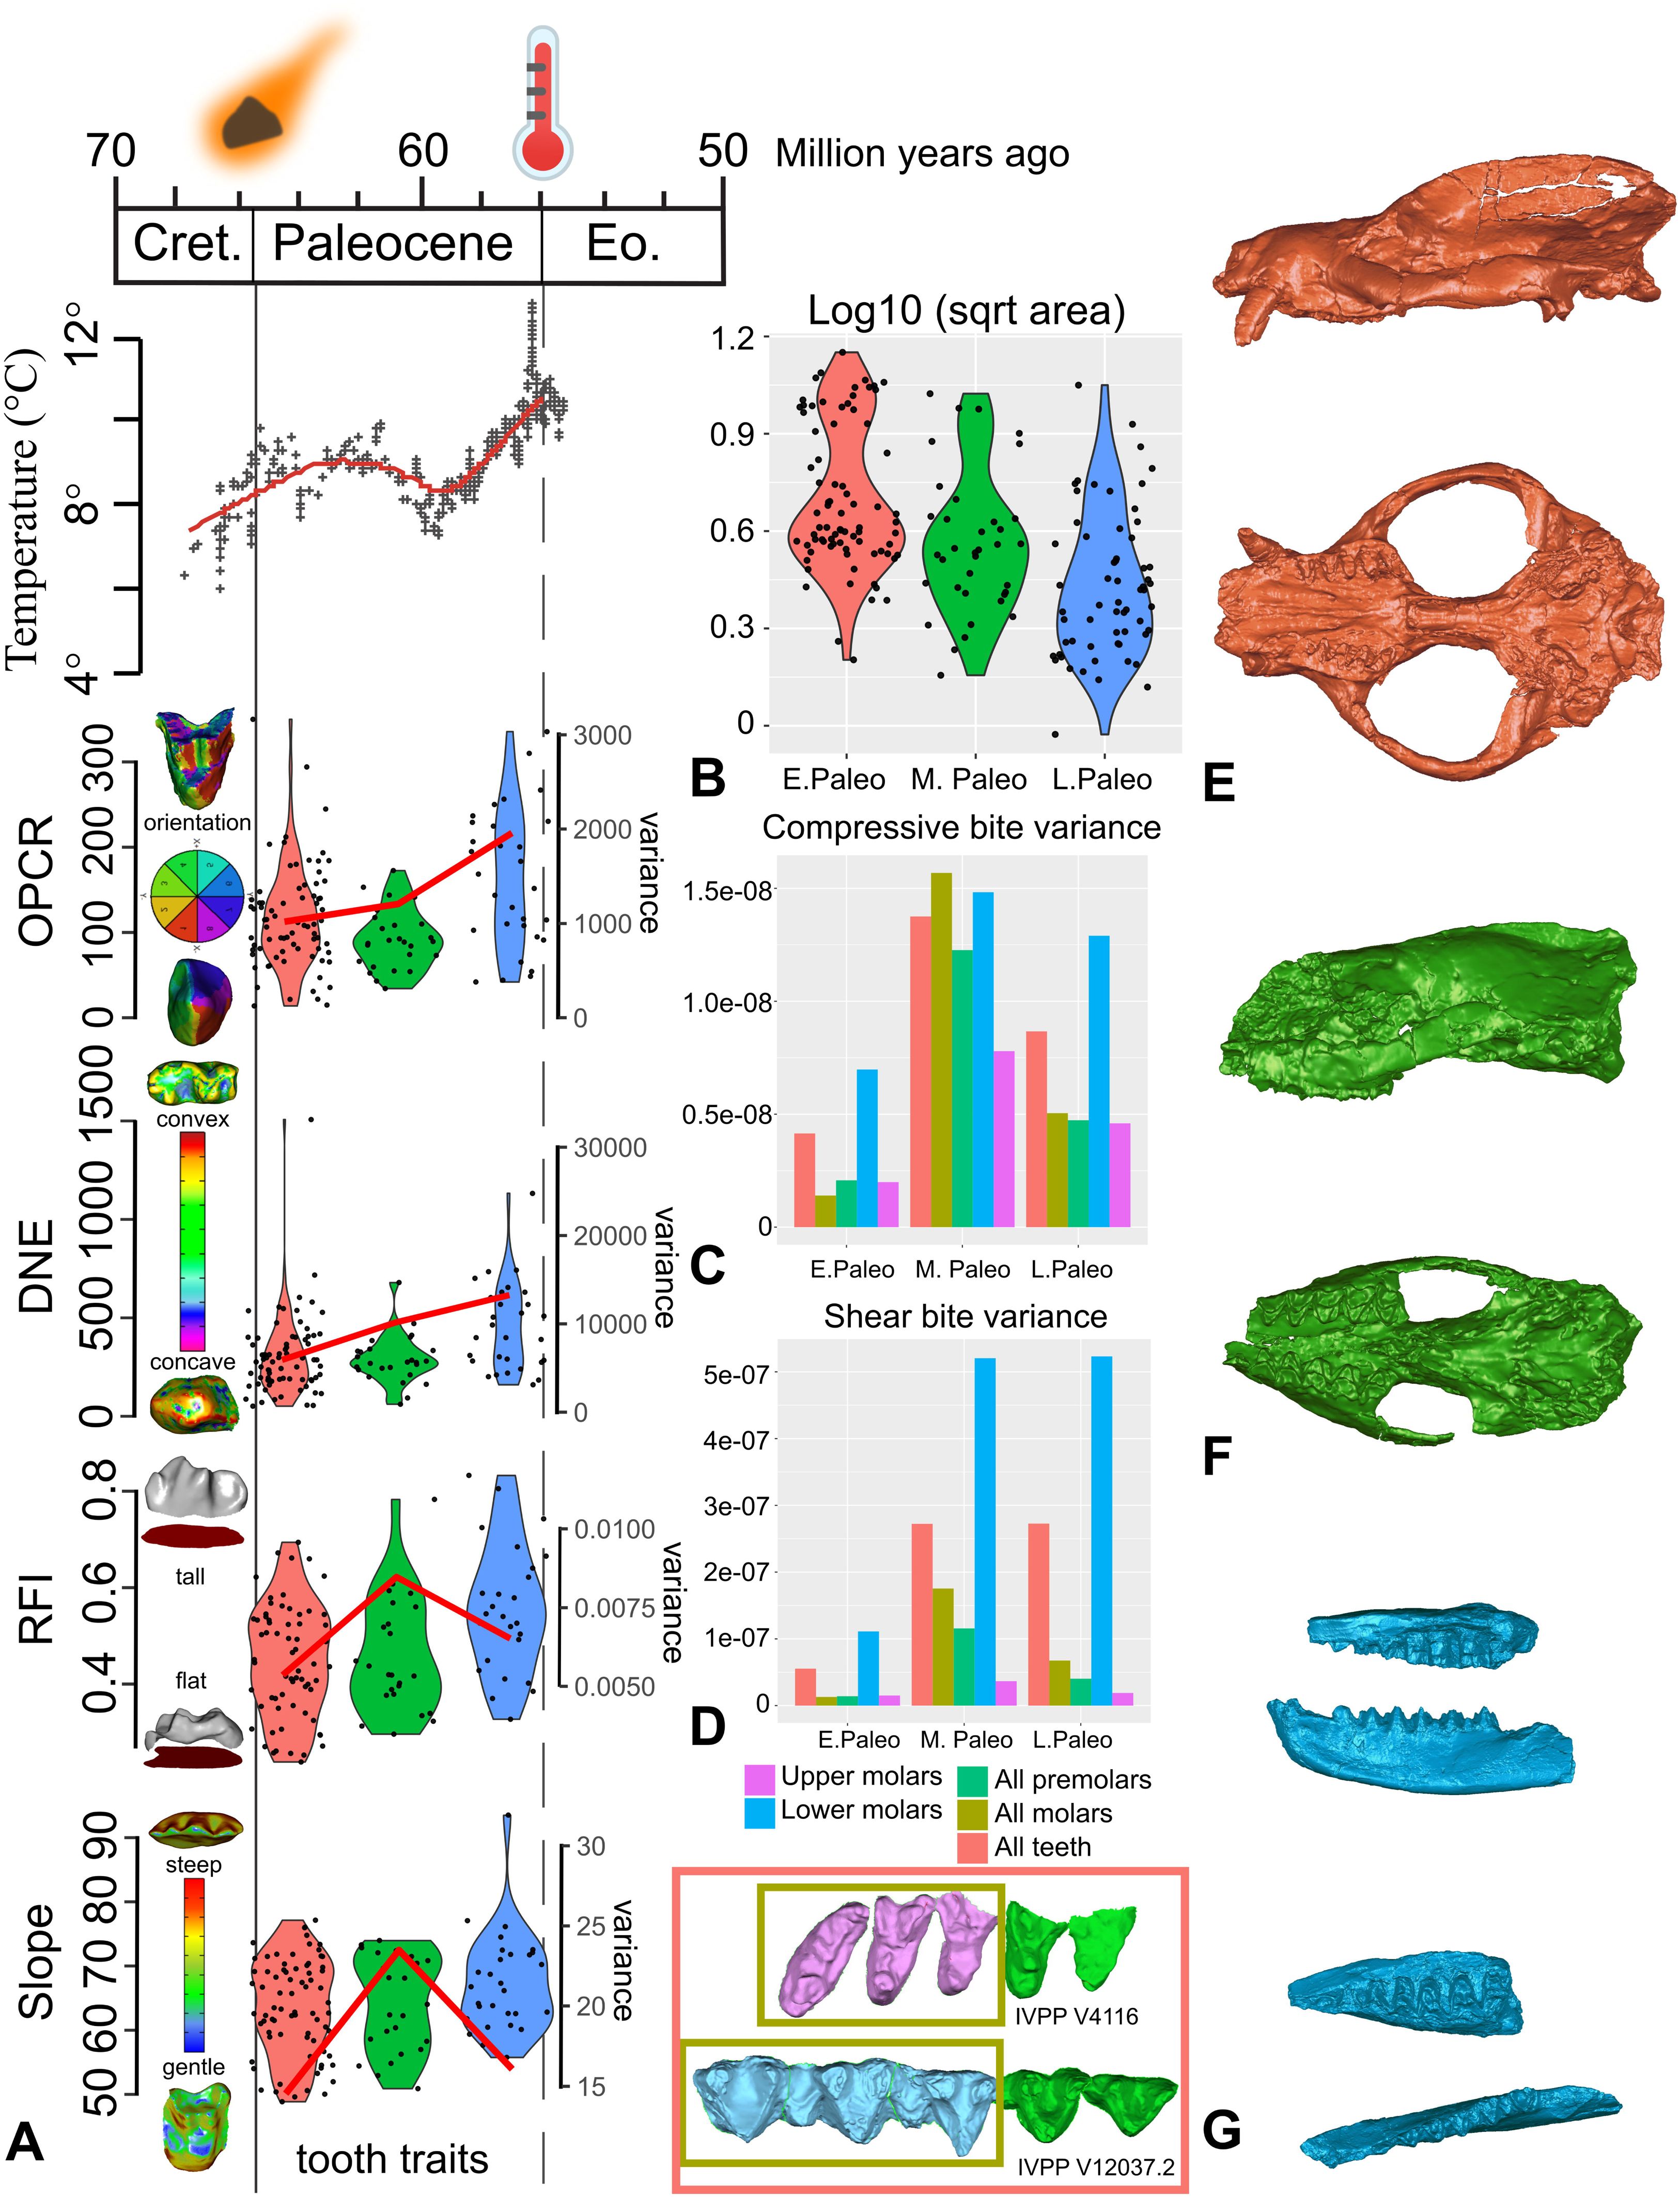
Temperature and fossil mammal dental trait shifts during the first 10 Myr of the Cenozoic.
(A) Dental topographic trait values (boxplots) and mean variance (red curves) during the first 10 Myr of the Cenozoic, signifying the time after the K-Pg mass extinctions and before the Paleocene-Eocene hyperthermal event. Global temperature curve based on Zachos et al.
61
. Dental traits measured include crown complexity (OPCR, orientation patch count rotated), curvature (DNE, Dirichlet normal energy), height (RFI, relief index), and slope. (B) Mammal tooth size distributions represented by log 10 square root tooth area, in units of log10 millimeters. (C) Variance of compressive bite performance based on tooth crown finite element simulations, in units of squared Joules. (D) Variance of shear bite performance based on tooth crown finite element simulations, in units of squared Joules. Examples of endemic Asian fossil specimens analyzed: (E) Lateral and ventral views of early Paleocene Chinese endemic pantodont (CEP)
Bemalambda nanhsiungensis
IVPP (Institute of Vertebrate Paleontology and Paleoanthropology, Chinese Academy of Sciences) V4116. (F) Lateral and ventral views of middle Paleocene CEP
Harpyodus decorus
IVPP 5035.1. (G) Lateral and occlusal views of late Paleocene CEP
Guichilambda zhaii
IVPP V12037.2 (dentary) and V12037.3 (maxillary fragment). Firey asteroid symbols indicate the end-Cretaceous asteroid impact in the Yucatán Peninsula; thermometer symbols indicate the Paleocene-Eocene hyperthermal event. Subdivisions of the Paleocene approximately correspond to the Shanghuan, Nongshanian, and Gashatan Asian Land Mammal Ages, respectively (see supplemental text for competing age boundary scenarios).
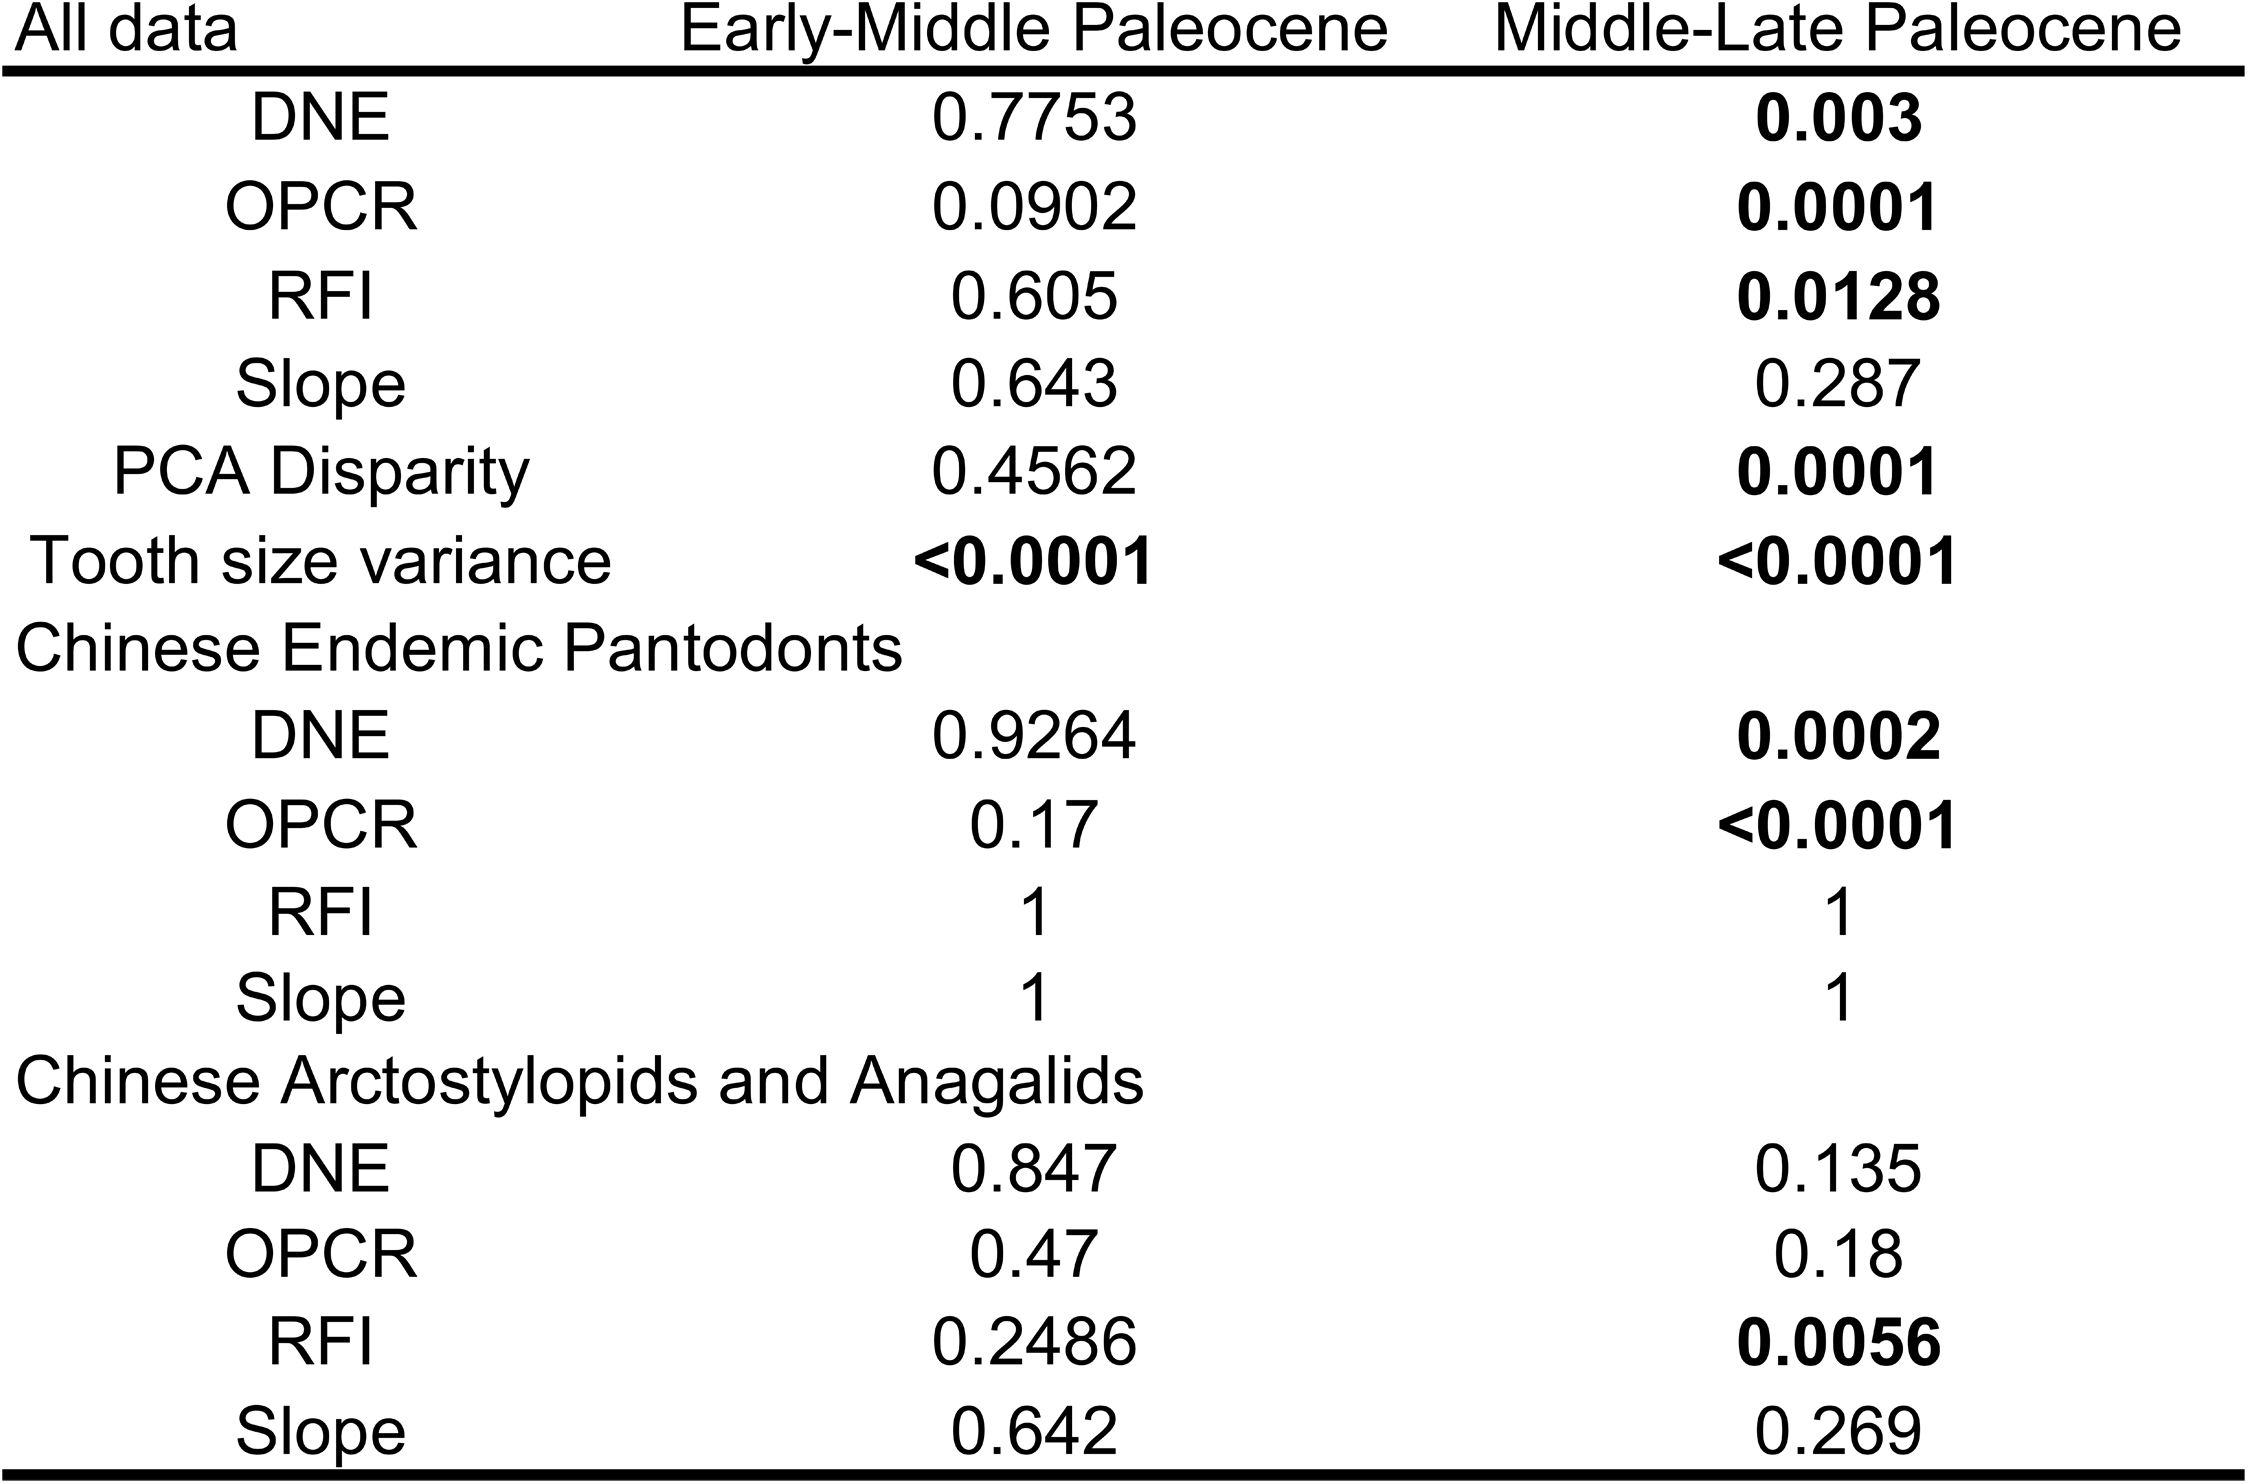
By contrast, there is no support for significant shifts in dental topographic trait mean values from the early to the middle Paleocene for the majority of analytical iterations of clade and dental data partitions (
Figs 1A
,
S4
;
Table 1
; Data S7). However, in most analyses we observed a significant shift in at least one dental topographic metric from the middle to the late Paleocene (
Table 1
; Data S7). The larger-bodied Chinese endemic pantodont (an ungulate-like archaic placental group; “CEP”) mammals tend to increase dental complexity (OPCR, orientation patch count rotated) and curvature (DNE, Dirichlet normal energy) whereas smaller, non-pantodonts (Chinese arctostylopids and anagalids; rodent-like archaic placental groups) in the dataset exhibited no significant dental trait shifts from the middle to late Paleocene (
Fig. S4
; Data S7). The transformation by CEPs in complexity and curvature indices relates to the capacity of teeth to resist wear and coincides with temperature and aridity increase towards the end-Paleocene thermal maximum event (
Figs. 1
-
2
). Multiple geological and geochemical proxies suggest that paleoclimate in and around the Nanxiong Basin K-Pg section in south China reflects a latitudinally much broader global tropical zone during the Paleocene
30
relative to present-day Earth, as well as rapid shifts between more versus less humid intervals during the first 10 Myr of the Cenozoic
31
. Results from feldspar-quartz (F:Q) ratios, clay mineral composition analysis, diffuse reflectance spectroscopy (DRS), stable carbon isotope analysis, and total organic carbon (TOC) analysis all support this regional paleoclimate profile
31
,
32
. Local climate reconstructions for the latest Cretaceous indicate relatively warm and dry intervals, followed by warm and humid climates during the earlier Paleocene, then a return to less humid but still warm conditions in the later Paleocene
32
. Chinese endemic pantodont dentitions tracked shifts in this paleoenvironmental progression.
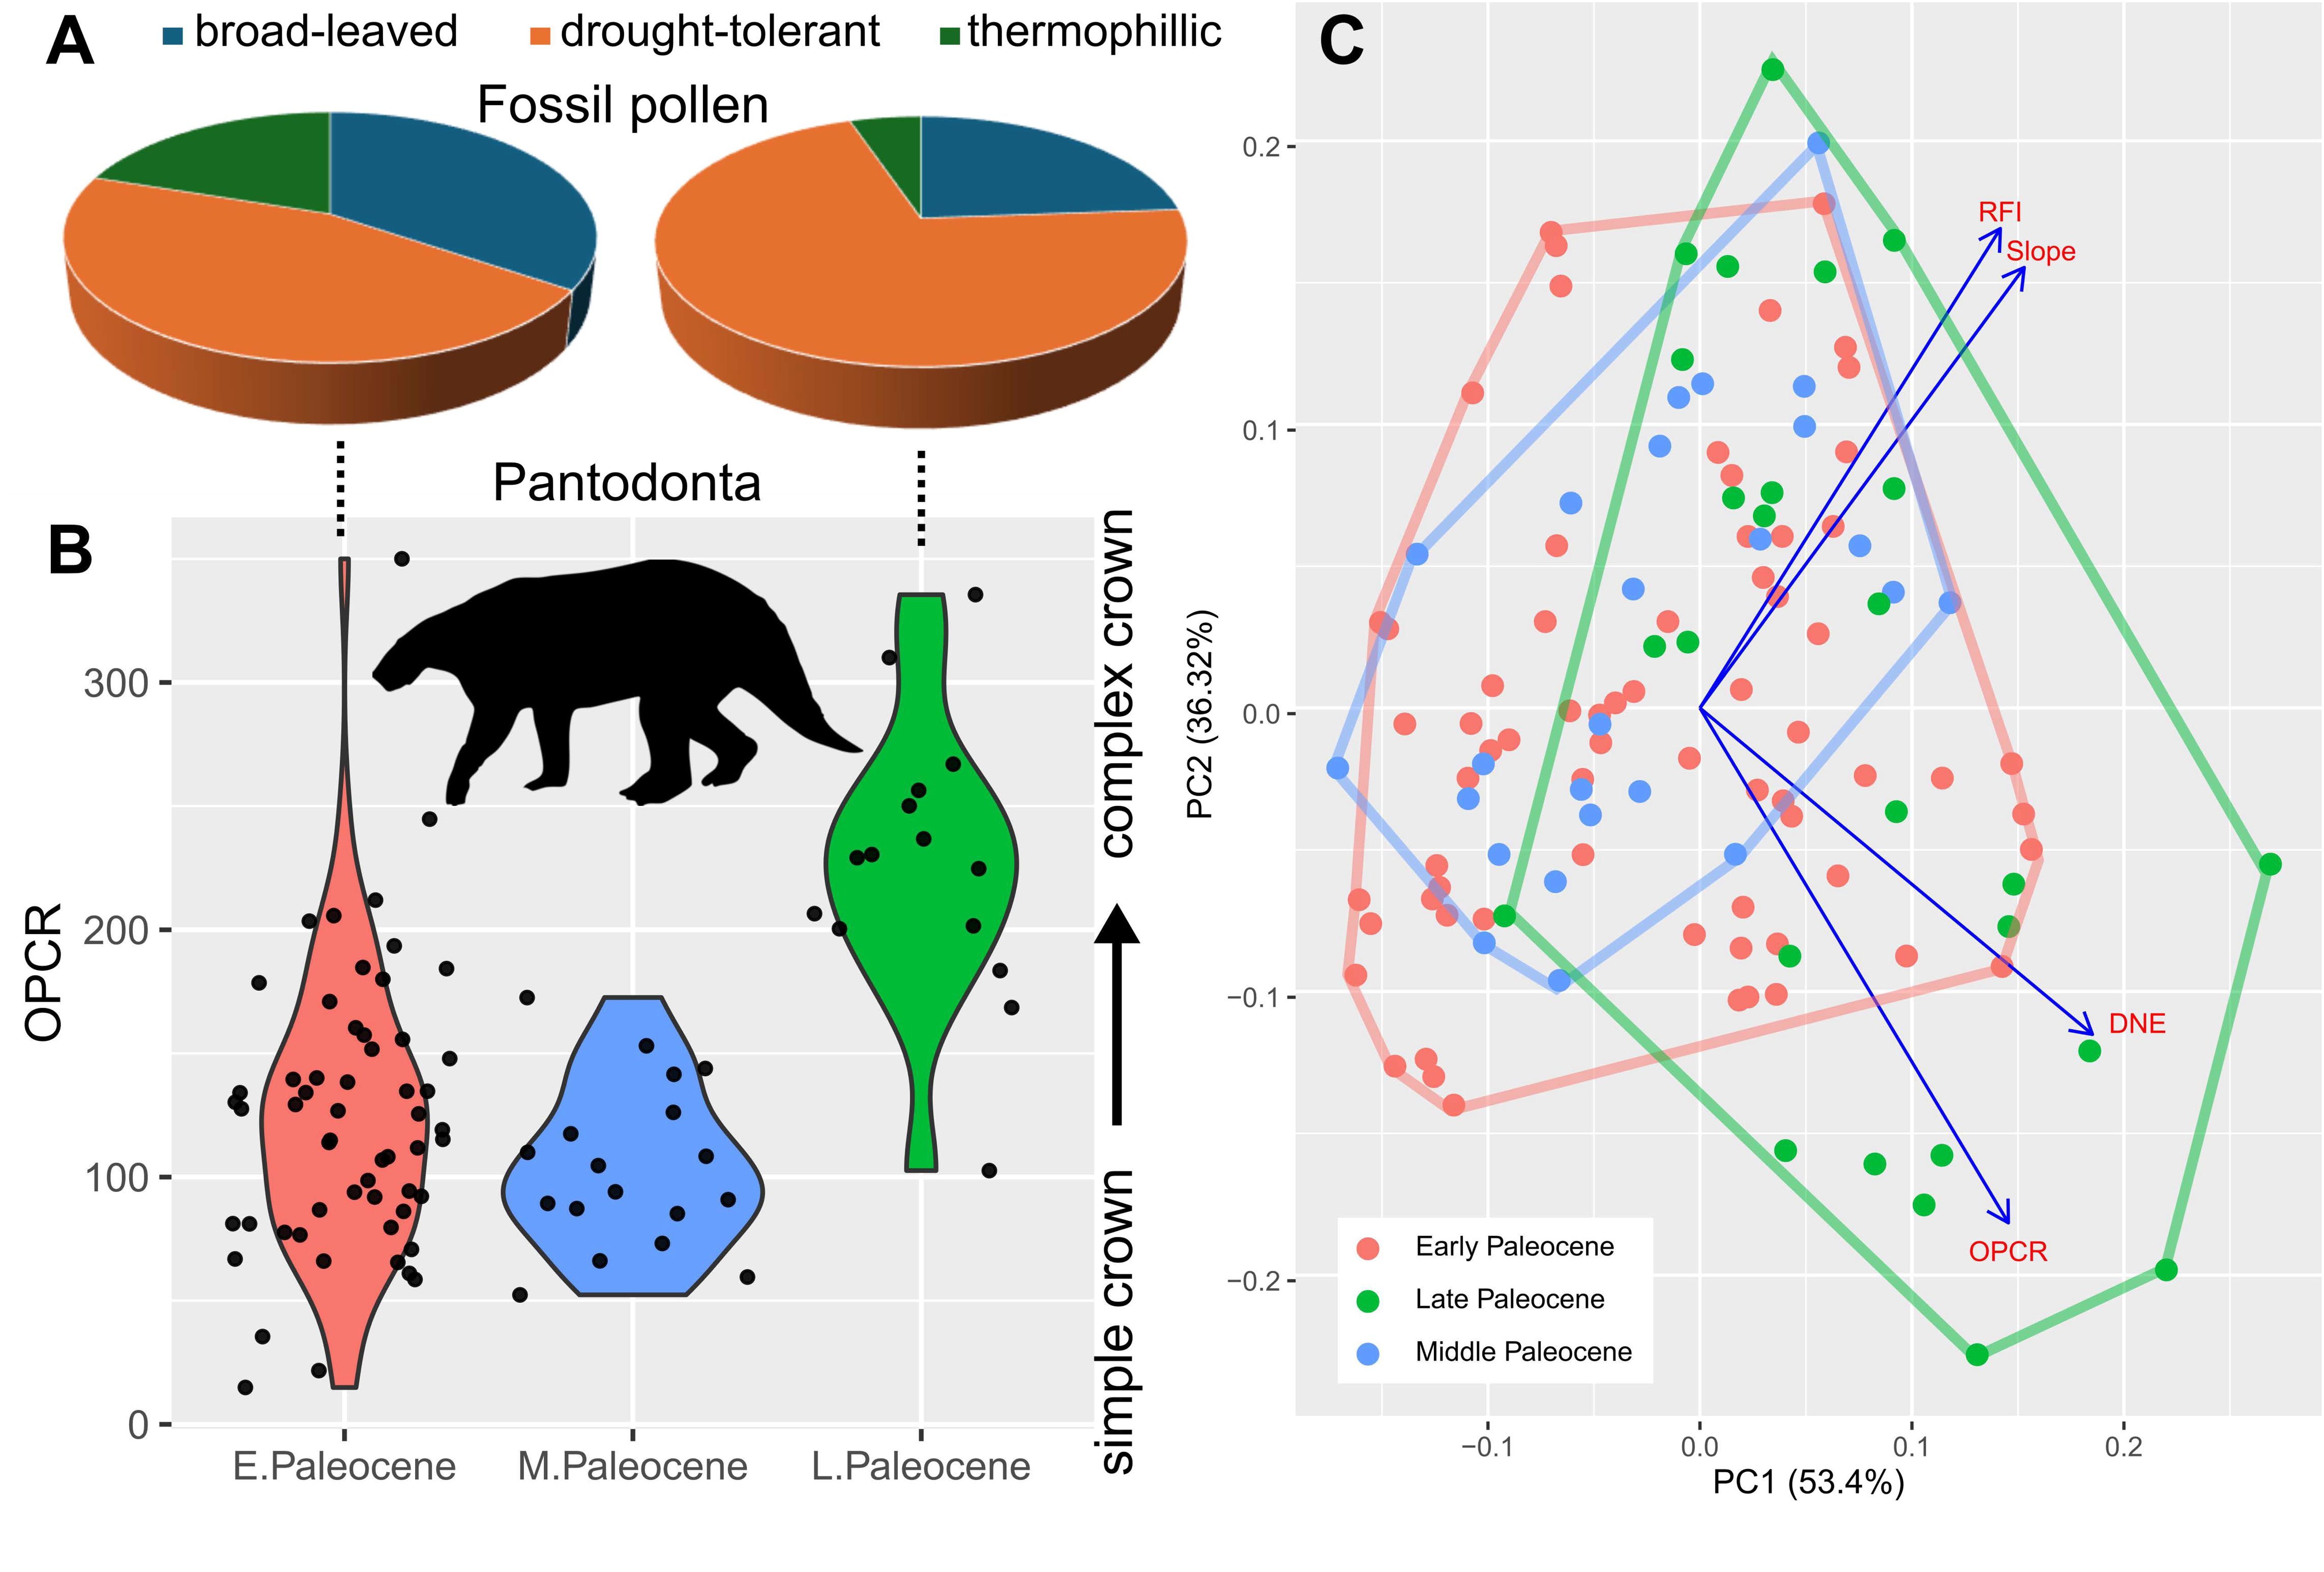
Association of paleopalynological data from the Nanxiong Basin, south China, and late Paleocene niche expansion in endemic Asian fossil mammals.
(A) Proportion of environmental humidity indicator taxa from early versus late Paleocene paleobotanical localities, respectively, in the Nanxiong Basin; data based on
35
,
36
(Data S12). (B) Boxplots of dental complexity (OPCR, orientation patch count rotated) in the Chinese endemic pantodont (CEP) data partition across the three Paleocene time intervals examined. Note the concomitant increase in CEP tooth complexity (OPCR) and increased proportion of drought-tolerant plant species in the Nanxiong Basin during the late Paleocene. (C) Principal component morphospace of all tooth data analyzed; convex hulls delineate overall morphospace occupation during each time interval. Eigenvectors of the four dental topographic traits are indicated in blue. Late Paleocene shift and expansion in dental topographic morphospace is statistically significant at the
p
= 0.05 level (
Table 1
). Pantodont silhouette by S. Traver from
.
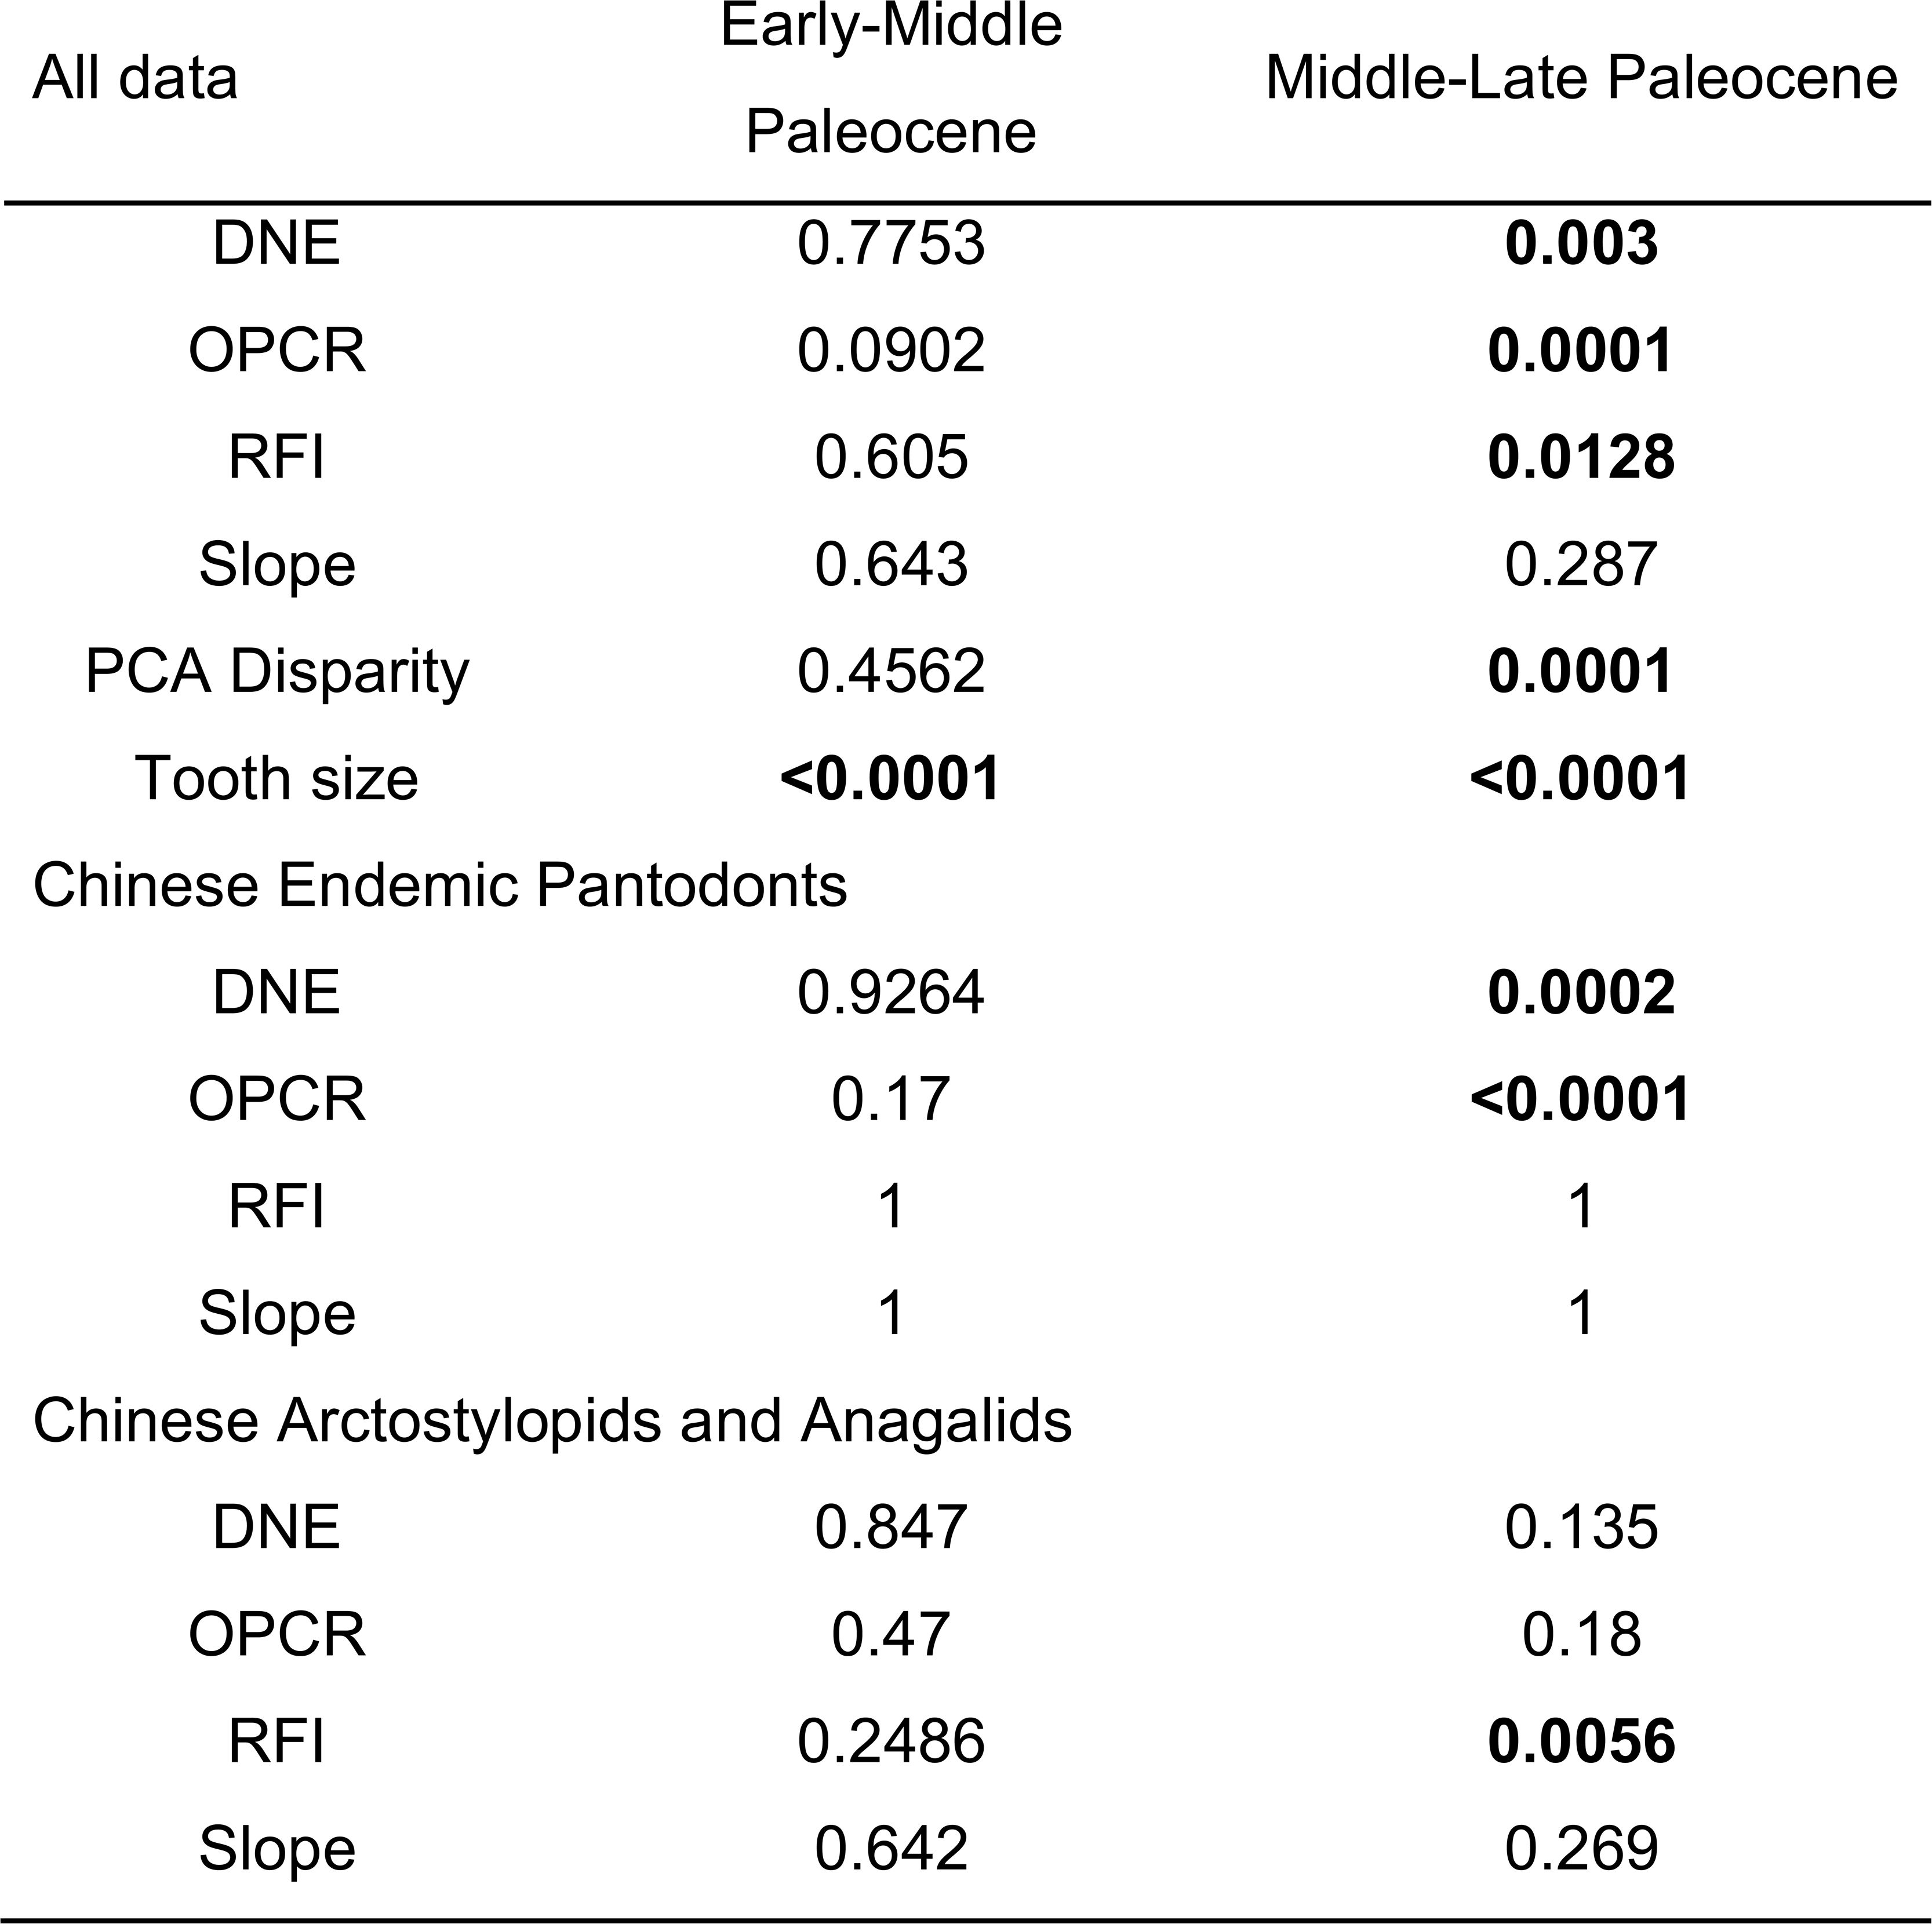
Pairwise t test of dental topographic trait and disparity differences across adjacent time bins.
Dental topographic trait differences are assessed across time intervals in all-data, Chinese endemic pantodont, and non-pantodont partitions. Dental trait disparity was estimated based on all principal component axes using the outputs of PCA. Tooth size variance differences were calculated from tooth area or square root of tooth area in all-data and no-outlier partitions to assess effect of outliers on statistical significance (see Data S6 for details). Bolded font indicates
p
values < 0.05.
The overall increase in dental complexity and curvature also coincided with an increase in drought-tolerant flora in south China (
Fig. 2
) and specifically with paleoenvironmental reconstructions in the Nanxiong Basin
33
. Palynological evidence suggests that in addition to a predominance of broad-leaved, deciduous plants mixed with a smaller percentage of conifers than in fossil localities further north
34
, south China also recorded drought resistant taxa such as the maidenhair fern
Pterisisporites
in the early Paleocene Shanghu formation
35
and again in late Paleocene samples
36
. Expanded comparisons across time and space suggest fossil pollen taxa that are indicators of seasonal aridity increased from 20.3% of late Paleocene pollen samples to 34.3% of early Eocene pollen samples
36
. These shifts appeared to have stabilized by the end of the Eocene, when taxonomically modern floras became established in Asia
37
. In addition to tracking Paleocene temperature trends (
Fig. 1
), Asian mammal dental topography (OPCR and DNE in particular) also mimicked trends in the marine realm, where global planktonic foraminifera records demonstrate a similar pattern in species richness curve, as well as with global δ
13
C
38
,
39
and south Pacific CO
2
levels
40
. These broader associations underscore the inference that endemic Paleocene mammals in south China comprised a dynamic assemblage shifting their dental morphology in step with regional and global environmental changes during the first 10 Myr after the K-Pg mass extinctions.
We detected a shift and expansion of mammal dental morphospace in the late Paleocene (
Fig. 2
). An overall shift towards increased dental topographic trait magnitudes in late Paleocene samples is driven mainly by CEPs (
Table 1
), despite the fact that they constitute a minority of the overall data (41% of teeth) as well as late Paleocene partition (21% of teeth). Additionally, dental metric disparity is significantly higher in the late Paleocene partition than in the two preceding time bins (
Table 1
). This pattern is driven both by increased dental curvature and complexity (DNE & OPCR; 78-100% support in per-tooth analyses,
Fig. S5
) in larger-bodied CEPs and crown height (RFI) in smaller-bodied non-pantodonts, in addition to differences in disparity among the clades (Data S7,
Fig. S5
; bootstrapped variance for DNE, OPCR, and RFI are at least twice as large in non-pantodonts compared to CEPs, and bootstrapped range lengths returned similar patterns). This suggests that an expansion of dental disparity in the late Paleocene occurred across the size spectrum of endemic Asian mammals. Over the same time interval examined, body (tooth) size disparity and mean were higher in the early Paleocene than in subsequent time intervals (
Fig. S8
,
Table S3
; also supported by premolar 4 and upper molar partition analyses), indicating that substantial increases in the disparity of dental complexity, curvature, and height lagged behind tooth size during the Paleocene. Dog-sized CEPs such as
Bemalambda
reached sizes not seen in late Cretaceous mammals from China such as
Zhangolestes
and
Kryptobaatar
, which are shrew- to gopher-sized
41
. This suggests a ‘brawn before bite’ pattern in endemic Asian mammals, partially mirroring the endocranial and jaw functional morphology patterns identified in their North American and European counterparts
21
,
22
. These findings raise the possibility that an initial size-driven post-K-Pg recovery followed by ecomorphological radiation was a global phenomenon, even as regional tectonic events such as the initial collision of the Indian subcontinent with Asia and Deccan Traps volcanism influenced local mammal evolution
42
,
43
.
Topography-performance covariation underlies mammal dental shifts
Within an overall pattern of increasing covariation between dental topographic traits and bite performance traits across the Paleocene time intervals (
Fig. 3
;
Table S1
), topographic versus performance trait variability shifted both from early to middle and from middle to late Paleocene time bins (
Figs S3
-
S4
). Early Paleocene to middle Paleocene DTA-FEA intra- and inter-correlations remained stable (
Fig. 3B
), but DTA-FEA inter-correlations strengthened while intra-DTA correlations weakened in the Middle to Late Paleocene transition (
Fig. 3C
). This transition pattern is in part due to the divergence of shape-performance linkages in CEP versus non-pantodont mammals, and is particularly driven by the upper and lower first molars (
Figs. S9
-
S11
). Dental topography variability tracked bite performance variability in non-pantodonts through time, peaking in the middle Paleocene (
Fig S4D
). By contrast, both intra- and inter-partition comparisons of topography and performance trends in CEPs showed low correlations through time (
Fig. S4G
). The coexistence of distinct topography-performance relationships in each time and taxon partition while overall covariation between the two trait groups increases between time bins is consistent with form-function decoupling
44
. Complex form-function linkages generally promote evolutionary redundancy and can enhance optimization of phenotypic traits when selective trade-offs are present
44
–
46
. The presence of functional redundancies underlies the high levels of dental topographic variability in Asian Paleocene mammals. Alternatively, varying degrees of independence between the two performance traits and dental topographic traits analyzed could allow the two aspects of the dentition to evolve in a decoupled manner (
Fig. 3
).
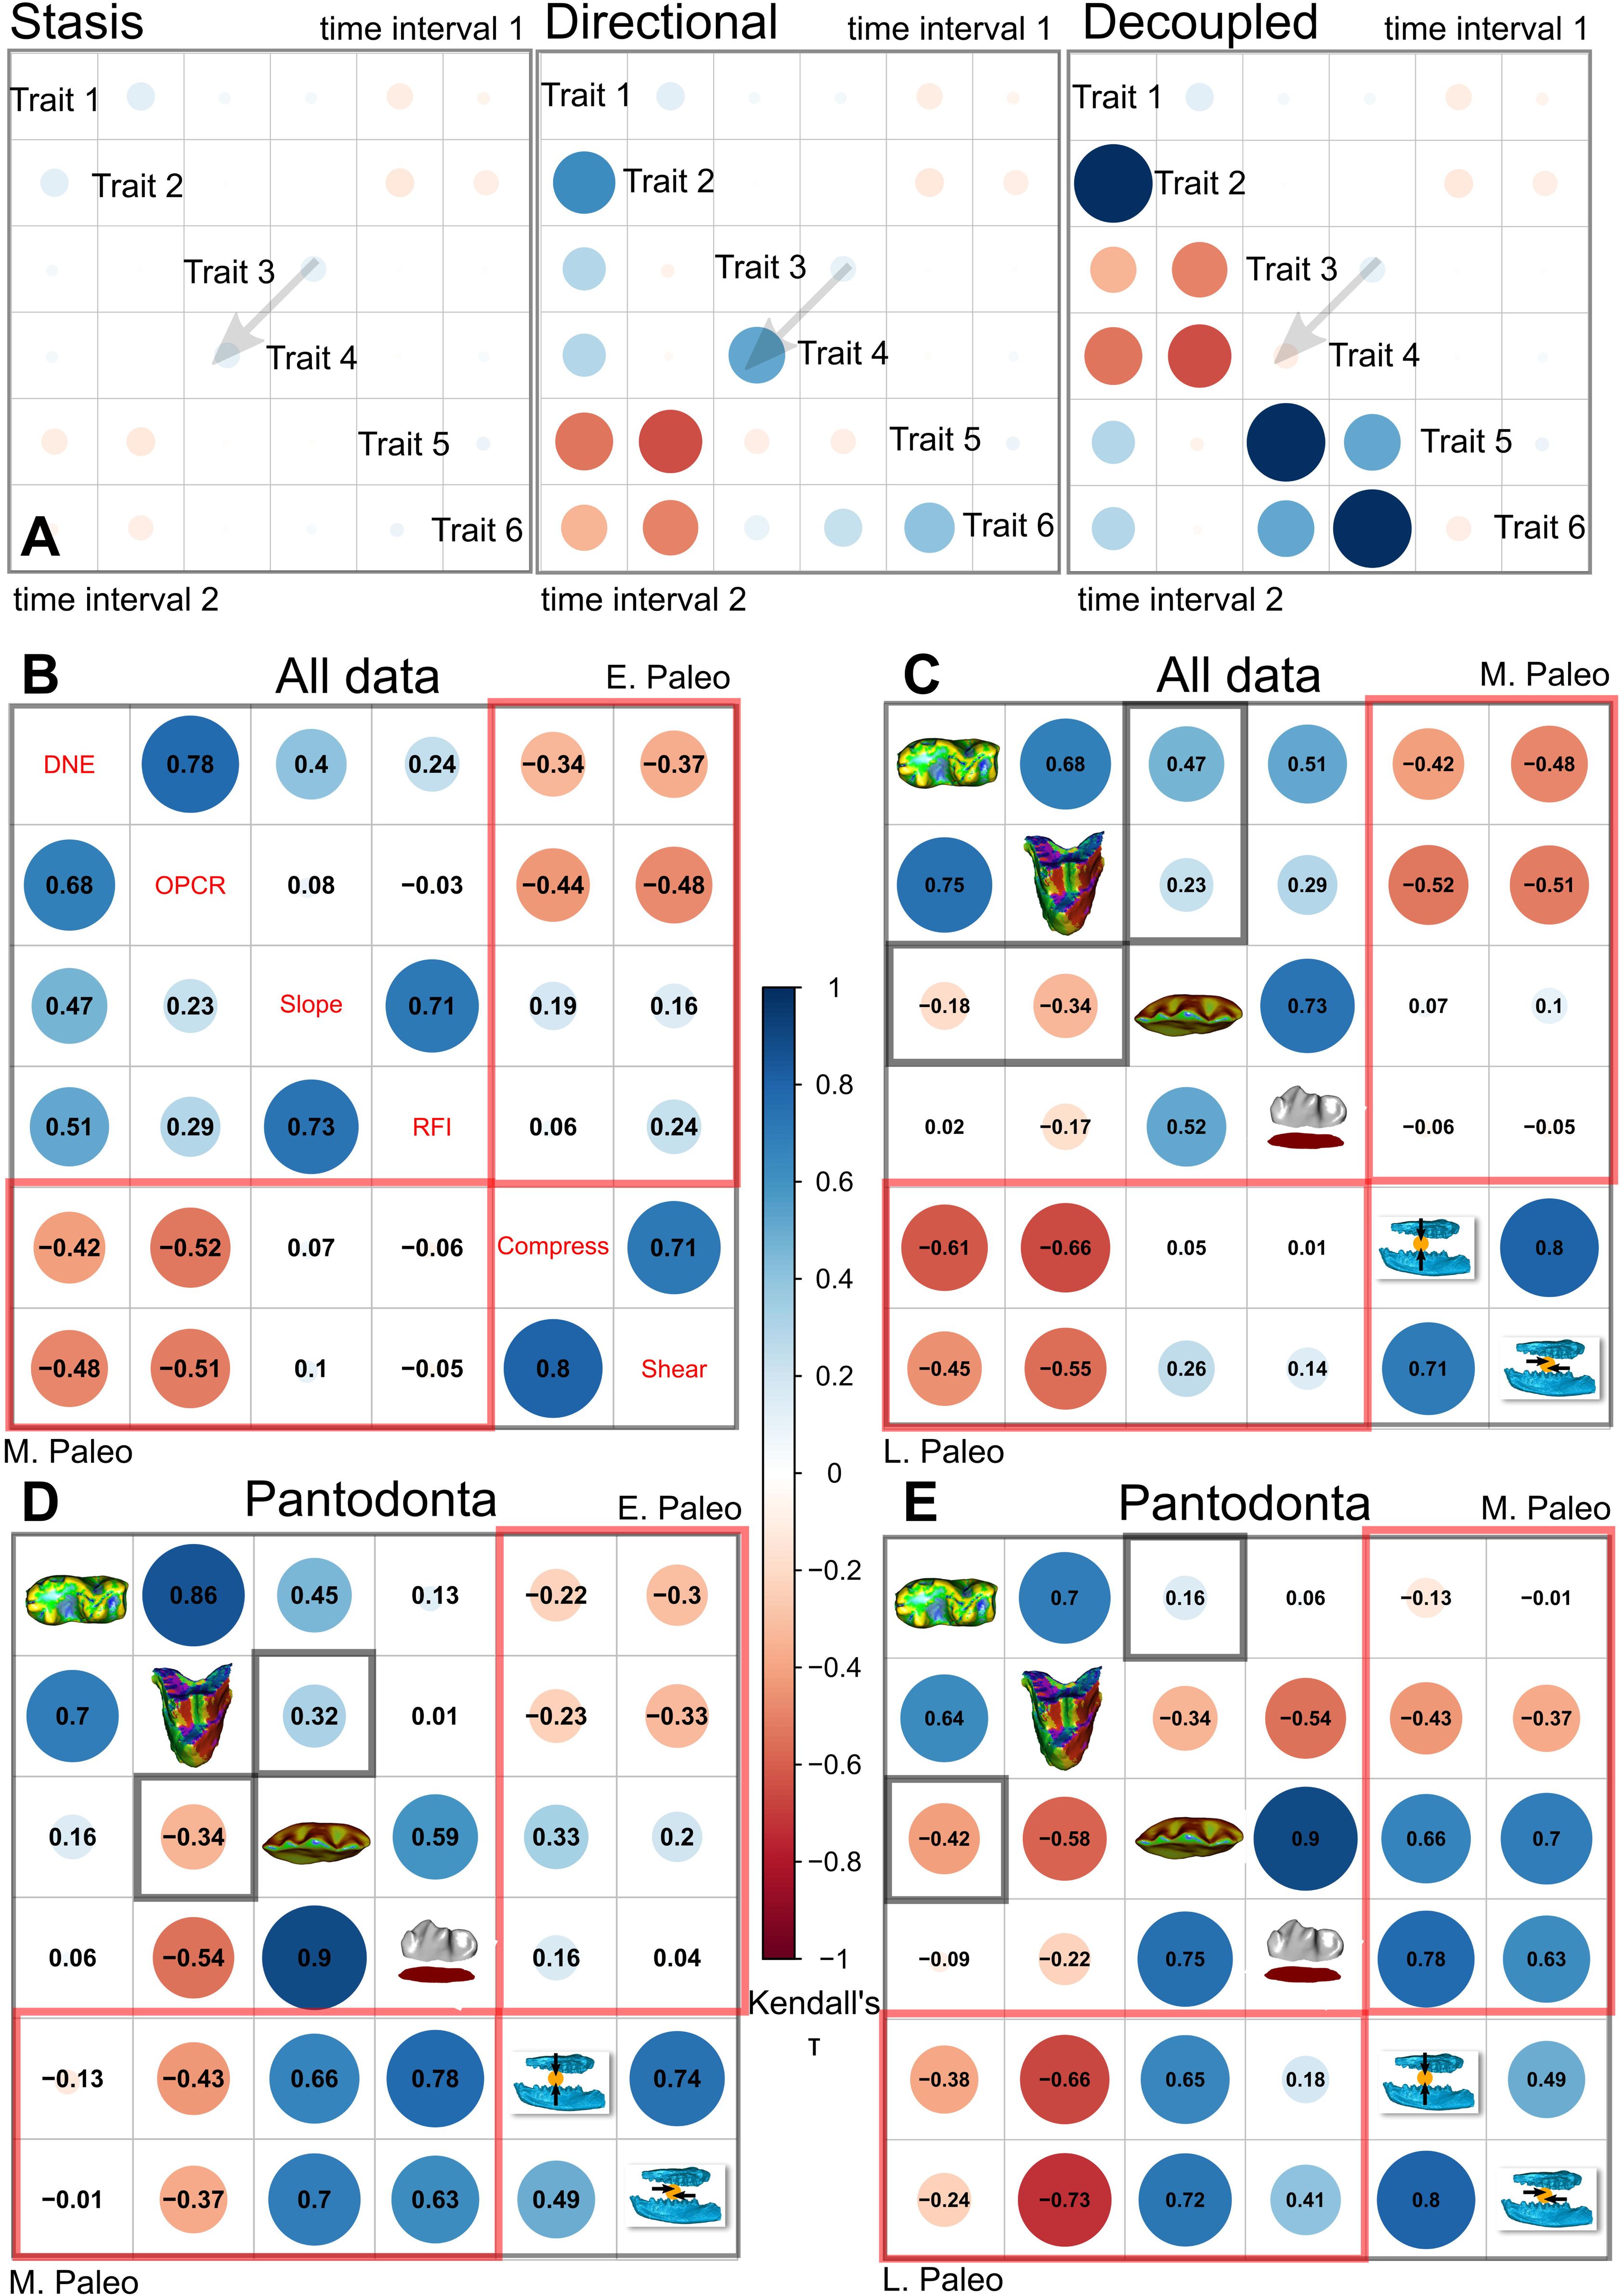
Correlation plots of dental topographic and bite performance traits in endemic Asian Paleocene mammals.
(A) Hypothetical correlation scenarios used to interpret stasis, directional, verses decoupled change through time in specimen data. (B) Pairwise ranked correlation coefficient estimated using Kendall’s τ between early and middle Paleocene dental topographic and performance traits in the main dataset. (C) Correlation between middle and late Paleocene traits in the main dataset. (D) Correlation between early and middle Paleocene traits in the Chines endemic pantodont (CEP) data partition. (E) Correlation between middle and late Paleocene traits in the CEP data partition. Topography-performance correlations are marked in red boxes. Decoupled/reversed trait correlations are marked in gray boxes.
South Asia as a Paleogene ‘Garden of Eden’ for placental mammals?
Among the most consequential implications of accurately interpreting post-K-Pg mammalian recovery dynamics in Asia is the ability to reconstruct the evolutionary conditions during the biogeographic origination of modern placental orders. Current knowledge and an overwhelming majority of data about the first post-dinosaur mammal ecological communities center on North American localities
12
,
47
, and secondarily from European records
48
. Yet, the fossil records of those continents pinpoint a high turnover of mammal faunas at the Paleocene-Eocene boundary, driven by the Cretaceous/Paleocene origination of major modern mammal clades elsewhere and subsequent dispersal of those lineages to the European and North American continents, respectively. At least five living orders (Primates, Rodentia, Lagomorpha, Perissodactyla, Eulipotyphla), representing over half of mammalian species richness today, trace their evolutionary origins to Asia
18
,
49
–
51
. There is also mounting evidence that other organisms, including fish and plant lineages, followed a similar biogeographic pattern
52
.
The abrupt appearance of early representatives of modern mammal lineages in North America has been formally operationalized by the ‘East of Eden’ model, wherein Asia is the ‘Garden of Eden’ and a biodiversity pump of living orders of placental mammals
53
and other organisms. Biogeographic modeling analysis of modern mammalian diversity also strongly identifies tropical south Asia, including the geographic regions occupied today by southern China, India, and southeast Asian countries, as the cradle of mammalian diversification since the Paleocene
54
. As geographically proximate faunal assemblages to the epicenter of the ‘Garden of Eden’ hypothesis, the endemic Paleocene mammals of the Asian paleotropics analyzed in this study exhibited a high degree of dental topographic variability while strengthening topography-performance covariation during a period of biogeographic isolation and regional and global climate changes. Such flexibility in dental form-function linkage permits ‘mix and match’ trait combinations rather than evolutionary transformation as a single unit, potentially enhancing the evolvability of feeding ecological traits as new environmental conditions arose
56
. This finding favors the scenario whereby many living orders of placental mammals were borne out of phenotypically and functionally plastic ancestral assemblages, including those that lived in south China, during the Paleocene
55
.
We further infer from these findings that episodes of fluctuating global warming during the first 10 Myr of the Cenozoic promoted the evolution of ‘all-purpose’ mammalian dentitions rather than those with specialized functions (
Fig. 3
). This prolonged dental topographic variability tracks extended post-K-Pg floral recovery times
36
,
57
, and suggests a ‘brawn before brains’ mode of placental mammal evolution may in part represent a series of correlated evolutionary shifts in sync with the steadily increasing complexity of Paleocene primary producers
20
,
37
. That a global signal would be detected in the splendidly isolated south Asian Paleocene assemblage is notable, and indicates that effects of climate forcing on post-K-Pg mammal recovery may be ubiquitous, as has been predicted for Earth’s ongoing rapid environmental shifts
58
. In response, Paleocene mammal clades in south China were relatively larger early on and increased covariation between dental topography and bite performance later, all the while maintaining high levels of variability in dental complexity and convexity (
Fig. 1
). These preconditions set the stage for the subsequent taxonomic turnover between archaic and crown lineages during the Paleogene to Neogene modernization of mammal communities
19
,
26
. As a primary interface against shifting food resources and the environment, the placental dentition was poised to play an outsized role in the explosive diversification following the K-Pg extinctions, with the masticatory complex having already completed the macroevolutionary transition to a mechanically stiff but phenotypically flexible jaw during the Mesozoic Era
59
,
60
. The end-Cretaceous extinctions and the climatic volatility that followed then set in motion the ecological release that enabled mammals to explore dental form-function to a far fuller extent in 66 Myr of the Cenozoic Era than during the preceding 150 Myr under the reign of dinosaurs. This sequence of ‘brawn before bite’ in tooth size, topographic, and performance evolution further refines the placental success story.
Method details
We focused sampling on three clades: Chinese endemic Pantodonta, Chinese Arctostylopida, and Anagalida. Additional data were collected on other clades (e.g., Chinese Tillodontia) opportunistically when well-preserved specimens were available (Data S1). These three main clades together represent >50% of the species found in Paleocene faunas across China
11
. They also individually represent the most diverse clades across the three Asian Land Mammal Ages of the Paleocene: Shanghuan, Nongshanian, and Gashatan. By contrast, these clades are reduced to <25% of species diversity in Eocene assemblages in China, finally disappearing altogether in the late Oligocene. Therefore, we take the three clades to be representative of mammal assemblage dynamics during the Paleocene time interval in China.
Historically, Paleocene fossil mammal faunas in China have been defined based on biostratigraphic criteria and supplemented by magnetostratigraphic correlations where available. Here we follow the assessment of
62
in generally correlating the Shanghuan Asian Land Mammal Age (ALMA) with the Puercan and Torrejonian North American Land Mammal Ages (NALMAs), the Nongshanian ALMA with early to middle Tiffanian NALMAs, and the Gashantan ALMA with late Tiffanian and Clarkforkian NALMAs, respectively (see
11
for an alternative interpretation). Additionally, the Shanghuan and Nongshanian boundary was interpreted by
25
to be at the top of Chron C27N, which is dated at 60.920 Myr ago in the Geomagnetic Polarity Time Scale
63
but indicated as closer to ∼62.3 Myr ago in
62
. Similarly, the Nongshanian-Gashatan boundary has been variably defined at 59.24 Myr ago
62
or the base of Chron C26N, which is 57.911 Myr ago
63
. In contrast, the end of the Gashatan coincides with the Paleocene-Eocene boundary at 56 Myr ago and has been consistently defined as such
62
. Given these existing uncertainties, we use the terms ‘early Paleocene’, ‘middle Paleocene’, and ‘late Paleocene’ to refer generally to the Shanghuan, Nongshanian, and Gashatan ALMAs, respectively, in this study.
We analyzed 200 individual teeth from 48 specimens, representing 37 species (Data S1-S2). The teeth represent 2 upper first premolars, 4 upper second premolars, 15 upper third premolars, 19 upper fourth premolars, 22 upper first molars, 23 upper second molars, 16 upper third molars, 3 lower first premolars, 5 lower second premolars, 13 lower third premolars, 17 lower fourth premolars, 20 lower first molars, 22 lower second molars, and 19 lower third molars. These tooth positions were selected from a broader examination of ∼300 individual teeth from 72 specimens. We vetted the specimens and excluded 99 tooth positions (∼33% of teeth initially chosen for possible inclusion) from our analyses because they either (1) were partially or completely broken at the crown, (2) were in an advanced stage of attritional wear where no cusps could be identified, or (3) possessed a combination of the two aforementioned conditions. The assigned geologic age of the studied specimens spans the entire Paleocene, binned into early (n = 91 teeth), middle (n = 46 teeth), and late Paleocene (n = 63 teeth) data partitions. To maximize sample size while minimizing disturbance to more delicate specimens, a combination of original specimens and previously produced high-fidelity specimen casts were used in our sampling of dental crown morphology.
Given the rarity of Paleocene fossil material from China, we combined data from different tooth positions into three pooled samples, one for each of the time intervals examined (early, middle, late Paleocene). We treated the pooled samples as representative of the range of dental topographic features and bite performance traits available to the mammal taxa under study. In this way, the variance estimates are interpreted as measures of the morphological and performance heterogeneity present in each time interval dataset. To further tease out the possibility of specific tooth positions driving the overall trends observed in the pooled samples, we also performed the DTA, FEA, DTA-FEA correlation, and tooth size through-time analyses using per-tooth data partitions.
Tooth shape estimates using Dental Topographic Analysis
We digitized dental crown morphology via microCT either using a GE v|tome|x m 300/180 kV micro-computed-tomography system (GE Measurement & Control Solutions, Wuntsdorf, Germany), housed at the Institute of Vertebrate Paleontology and Paleoanthropology (IVPP), Chinese Academy of Sciences (CAS), or a GE Phoenix Nanotom M in the Functional Anatomy and Vertebrate Evolution Laboratory, University of California, Berkeley. Projection images (1,000 to 1,500 images depending on specimen size) were acquired with an isotropic voxel size of 10 to 40 μm, at an energy range of 120-150 kV, current of 100-150 μA. Additionally, surface 3D scans (generated using IVPP’s Artec Space Spider 3D scanner, with a precision of 0.05 mm and resolution of 0.1 mm) were used for larger specimens to efficiently obtain surface morphology data. The enamel caps (the crown portion of each tooth above the enamel-dentine junction) were extracted from the specimen models using Geomagic Wrap v2021; all crown surface holes (generated from scanning imperfections or digitally removed sediment) were patched, the models were remeshed with triangles that have aspect ratios (base:height or edge-edge) of <10 and decimated to ∼10,000 triangles. Finally, we standardized the spatial orientation of all tooth crowns before exporting them as .ply files for dental topographic analysis (DTA). Individual tooth crown (enamel cap) models have the Z axis normal to the occlusal plane, the X axis parallel to the mesial-distal axis, and the Y axis parallel to the labial-lingual axis.
Exported meshes were further vetted and prepared for DTA within the R programming environment. We used functions implemented in the
molaR
R package
64
for all of the steps described next. First, all .ply files are further cleaned using ‘molarR_Clean’ to remove floating points/vertices and any triangular faces with zero area. Then, the batch function ‘molarR_Batch’ was used to calculate four dental topographic metrics: DNE, OPCR, Slope, and RFI.
Dirichlet Normal Energy (DNE) is a measure of occlusal sharpness, using a quantification of surface energy in tooth crowns relative to a gently curving or flat mesh surface. Steep, high, and/or shearing cusps tend to produce higher DNE values in DTA, whereas bulbous cusps tend to produce lower DNE values
65
,
66
. DNE has been used to successfully distinguish folivores, omnivores, and frugivores in euarchontan (primates, colugos, tree shrews) mammals
65
,
67
.
Orientation Patch Count Rotated (OPCR) is a measure of tooth crown complexity, using quantification of distinct patches on the crown face that possess unique orientations. Teeth with larger number of cusps and crenulations tend to produce higher OPCR values, whereas teeth with fewer cusps and simpler ridges tend to produce lower OPCR values. This metric has been used effectively to distinguish convergently evolved carnivore versus herbivore species across multiple mammalian orders
68
. DeMers and Hunter
69
suggest that OPCR does not currently provide a reliable approximation for the degree of adaptation to herbivory, and that any interpretation of ecomorphological differences should be made within a taxon-specific context. Given the narrow set of clades targeted in our dataset, we interpret increasing OPCR as an indication of increased functional capability to process vegetation. A related measure, slope, quantifies the mean tilt of the tooth surface relative to the occlusal plane. Teeth with lower and more gently curving cusps tend to have lower slopes, whereas teeth with sharp and/or abruptly ridged crests tend to have higher slopes.
Relief Index (RFI) is a measure of the relative height and complexity of the tooth crown, using the values of the 3D surface and 2D ‘footprint’ areas of the tooth crown. RFI has been shown to be effective in distinguishing frugivores from insect and leaf specialists in euarchontan mammals
65
. Furthermore, RFI is also able to distinguish carnivoran species at different trophic levels and dietary breadths
66
.
Overall, we use these DTA traits as indicators of ecomorphological capacity, but do not link them explicitly to dietary categories. The craniodental morphology of archaic placental clades in general have not been demonstrated to share the same structure-function linkages as crown mammals, so aforementioned linkages between DTA and dietary ecology from studies of extant species only serve as evidence that DTA is a potentially useful ecomorphological proxy. We do not directly apply those DTA-diet relationships to the Paleocene fossil mammal dataset.
All tooth crown models are provided as ply files and deposited in FigShare (10.6084/m9.figshare.28611854).
Tooth performance estimates using Finite Element Analysis
The common inference that dental morphology can reflect dietary adaptations makes an underlying connection between the two traits through biomechanical performance; the mechanical performance imbued by a particular morphological configuration accomplishes one or more food acquisition and/or processing tasks. Such mechanical performance links can be tested using experimental and simulation approaches on both theoretical grounds and actual tooth shapes
70
. Here we applied a simulation approach to estimate two general performance traits commonly interpreted for mammalian tribosphenic teeth: puncturing/compressing and shearing/grinding
71
. The ancestral therian tribosphenic stroke, or the chewing movement underlying mammals with unfused mandibular symphysis and tribosphenic molars, has been reconstructed to involve significant components of (1) long-axis rotation in each hemimandible and (2) mortar-and-pestle grinding between upper and lower cusps
72
. These movements are associated with the ‘lock-and-key’ occlusion of a stereotypical mammalian tribosphenic dentition, which exhibit tall crest-like cusps in the trigonid and lower basin-like valleys in the talonid of lower molars that articulate with their corresponding upper teeth (
Fig. S3
).
We used finite element analysis (FEA) to estimate the work efficiency of different tooth crowns subjected to compressive/puncturing and shearing/grinding forces, the two major masticatory actions of tribosphenic teeth
71
,
73
,
74
. Adequate compressive and puncturing forces applied through individual or combined action of cusps are needed to overcome the fracture strength of brittle and tough food such as seeds and invertebrate exoskeletons in order for individuals to access soft and/or more nutritious tissues within. Sufficient shearing and grinding forces applied through surfaces or cusp edges are necessary to further break down food boli into smaller pieces to aid in the digestive process. The combination of these two major functions of tribosphenic teeth is thought to be a foundational adaptation that enabled the mammalian radiation
71
,
72
,
75
. We focused on the dental enamel portion of the tooth crown in our biting simulations because it is the most mineralized vertebrate tissue and typically the best-preserved component of fossil teeth. The fracture mechanics of mammalian dental enamel is thought to be intimately related to dietary function
76
, including the evolution of different enamel thickness in different feeding ecomorphologies
28
. It is important to note that because the dental data available for this study included not only CT scans, but also surface scans and specimen casts, enamel thickness was not quantifiable for most specimens in our dataset (see below for a description of enamel thickness scaling procedure applied in the simulations). The two masticatory scenarios tested, compressing/puncturing versus shearing/grinding, have previously been shown to be broadly connected to tooth topology. Taller cusps (approximated in our study by Relief Index and partially by Slope) and more convex crowns (approximated in our study by DNE) tend to exhibit higher strain in finite element models of hypothetical tooth shapes
77
. However, there is by no means a consensus on the presence of a tight form-function linkage across all tooth types and/or clades. Whereas a dental topography to food mechanical property linkage can be detected in some extant carnivores
78
,
79
, bats
80
, and primate-like tooth models
81
, a form-function relationship between dental topography and tooth/food mechanical properties is absent in other model systems
67
,
82
. Therefore, we incorporated biomechanical simulations as an explicit test of the mechanical performance associations implied by the DTA-flora correlations established in the dental topography and paleoenvironmental portion of our analyses. The main question addressed by these simulations is not necessarily whether a form-function linkage exists in the Paleocene mammal dataset, but whether there is a consistent relationship between DTA and FEA traits across the three time bins of the Paleocene. If such consistent linkages are observed, it would suggest a stasis in dental topography and compressive/shearing performance through the first 10 million years of the Cenozoic in our dataset; alternatively, any significant changes in the topography-performance relationship would indicate substantial evolutionary change through the same time period.
We imported the same tooth crown models generated for DTA into the Strand7 finite element software (Strand7 Pty Ltd, Australia) to create finite element models of the individual teeth. The tooth meshes are composed of two-dimensional, three-noded triangular elements ranging between 9,000-10,000 elements, with assigned thickness parameter (see below) so they behave similarly to single-layer 3-D elements. A convergence test was done on two of the specimens (IVPP V5228, V5231) and indicated that the <10,000 three-noded triangular plate elements (tri3) returned simulation output values with less than 10% deviation from higher resolution meshes of the same models (
Fig. S3
). Therefore, we deemed the default resolution of the tooth meshes used in DTA to be sufficient for finite element simulations. Furthermore, because the dataset contained digital models built from both CT and surface scan data, not all specimens have enamel thickness information. Although increased enamel thickness has been associated with durophagy in mammals, there appears to be taxon-specific patterns of enamel thickness to tooth size and dietary ecology, in addition to extensive variation in intra-tooth enamel thickness distributions
83
–
85
. In absence of information on enamel thickness differences among the taxa studied, we standardized the thickness of the tooth crown models isometrically to be 10% of the total surface area of a given tooth model. As such, the simulation results should be treated as enamel cap shape-derived performance traits, rather than those based on a fully parameterized enamel model incorporating localized thickness and inter-specific allometric differences.
We scaled applied forces on the teeth, simulating compressive or shearing loads, to be a value equivalent to total model surface area (but in units of Newtons instead of mm
2
). Compressive loads were represented on each tooth by a single nodal force vector directed towards the base of the crown along the height axis of each tooth, on the tallest cusp or cuspid (which is typically the protocone for upper molars and protoconid for lower molars, or the main cusp in premolars). This configuration simulated a compressive load directed into the tallest cusp (towards the root) on a given tooth from a food item (
Fig S3
), as reconstructed for the mammalian tribosphenic bite during a crushing or puncturing movement
71
,
72
. Shearing loads were represented on each tooth by two nodal force vectors, one on each of the two tallest cusps or cuspids; the two nodal forces are of equal magnitude but opposing directions, perpendicular to the long axis of the tooth and in the occlusal plane. This configuration portrays a shearing motion along the short axis of the tooth (
Fig. S3
), and simulates tooth-to-tooth and tooth-to-food contact during the ‘mortar and pestle’ grinding rotation movement reconstructed for the ancestral mammal tribosphenic bite
72
. This force magnitude standardization procedure effectively generates identical force to area ratios across the models, ensuring that the magnitudes of mechanical stress placed on the model are the same across models of different sizes; furthermore, we adjusted the strain energy values collected for each tooth model simulation using the volume and input force ratio-based correction equation provided in
86
. Given our objective to assess the association between relative performance traits and DTA metrics, with the latter being size-free variables, only the relative magnitudes of bite performance, rather than absolute values, were collected from the performance analyses. After each tooth crown model was defined using the criteria outlined above, homogenous material properties were assigned. All models were defined as plate models (with thickness scaled to surface area) with a Young’s (elastic) modulus of 80 GPa
87
and Poisson Ratio of 0.3. Next, each tooth was constrained from translation and rotation using four nodal constraints distributed in the four corners of each tooth, respectively (
Fig. S3
).
All bite scenarios were solved using the linear static solver implemented in Strand7. A total number of 400 analyses were performed (one compressive bite and one shearing bite simulation for each of the 200 tooth specimens in the dataset). We extracted two traits from the models: compressive bite strain energy and shear bite strain energy. Strain energy is defined as the area under a stress-strain curve of an object under load; operationally it measures the amount of work done by the load to deform the object (analogous to experimental work-to-fracture measurements)
88
. An object that is more resistant to deformation would have lower strain energy than an object that easily deforms under load. The use of work-to-fracture measures to assess tooth performance is consistent with the understanding of mammalian tooth enamel as a fracture-prone, yet fracture-resistant, biological tissue
89
. In such a framework, fracture resistance is expected to be directly related to the amount of force an individual is able to exert through the tooth crown during mastication, and by extension the hardest or toughest food item that can be processed without catastrophic damage to the tooth crown itself. Fracture resistance (as approximated by strain energy in this study) is also likely to be a stronger target of selection in mammals compared to those of other toothed vertebrates, given the former’s diphyodonty (having only two sets of tooth instead of continuous dental replacement) and thus necessity to prolong usable tooth lifespan
83
. Therefore, we used strain energy values under compressive and shear bite simulation scenarios as a proxy for the effectiveness of each tooth crown model at resisting deformation from the respective biting forces. A tooth that is more resistant (i.e., have lower strain energy values) from compressive forces would be able to more effectively crush/puncture harder food items, and a tooth more resistant from shear forces would be able to cut/grind tougher food items. We modify Irschick et al.’s
90
definition of whole-organism performance and define bite performance in the context of this study as the capacity of individual tooth models to resist simulated compressive and shearing forces, which represent ecologically relevant factors that influence masticatory efficacy.
All finite element models are provided as NASTRAN/text files and deposited in FigShare (10.6084/m9.figshare.28611854).
Sensitivity validation of original versus cast specimen models
The tooth dataset developed in this study contains a mixture of CT scans of original and casts of fossil specimens. In order to assess the potential discrepancies in DTA and FEA trait values collected from cast versus original specimen derived models, either due to phenotypic details not captured in cast specimens or deterioration of epoxy or resin-based casts over time, we randomly sampled two specimens for which both original and cast based models were analyzed. Results from DTA and FEA of the CT-derived models of lower first molars from IVPP V5228 (
Altilambda pactus
) and V5231 (
A. tenuis
) were compared to those conducted on digital models built from CT scans of casts of those specimens.
We used the ‘n-point’ and ‘global’ alignment functions in Geomagic Wrap to first align the models using arbitrary homologous landmarks visually identified on both tooth models and then the automatic global alignment function to maximize overlap between the two models in 3D coordinate space. The ‘deviation’ function in Geomagic Wrap was then used to calculate summary statistics for linear deviations orthogonal to the surface of the original model. The V5228 Lm1 model showed a maximum deviation of 0.58 mm (5.8% of crown height) and average deviation of 0.04-0.09 mm (<1% of crown height), with a standard deviation of 0.11 mm (1% of crown height). The V5231 Lm1 model showed a maximum deviation of 0.38 mm (6% of crown height) and average of 0.03-0.04 mm (<1% of crown height), with a standard deviation of 0.06 mm (1% of crown height)(
Fig. S3
).
Quantification of uncertainty ranges for bootstrap sampling
We then subjected the cast-based models to DTA and FEA. In both cases, the DTA values between cast and specimen models are the most different for DNE (30-40% difference), followed by OPCR (18-32% difference), then RFI (2-13% difference), and finally Slope (1-5% difference) (Data S4). Also in both cases, adjusted compressive SE values differed by 14-41% and adjusted shear values differed by 20% (Data S3). Based on these specimen-cast validation tests, we set a conservative +/− 40% uncertainty range for all DTA and FEA values obtained from all cast-based tooth models. DTA and FEA trait mean and variance estimates used for downstream statistical analyses were then calculated using a bootstrap sampling scheme where 1,000 replicates of the DTA and FEA datasets were passed through the statistical tests (see Quantification and statistical analysis section, below). Overall, the early and middle Paleocene time bins contain around 50% cast data, whereas the late Paleocene time bin contains 66% cast data. If data uncertainty from original versus specimen models present a major signal, we would expect the late Paleocene time interval to always show higher variance given an abundance of cast data in that time bin. We did not observe any consistent trends of high variance in the late Paleocene in the 1,000 bootstrap samples, suggesting that the results are not significantly biased by data quality differences between cast and original specimen derived models (
Fig. S4
).
Time bin duration correction and tooth position ratios
According to Ni et al.
99
, the Shanghuan Asian Land Mammal Age (ALMA) faunas in Guangdong and Anhui range from 66-61.6 Ma (or 4.4 Myr in duration), the Nongshanian ALMA faunas in Guangdong, Jiangxi, and Anhui range from 61.6-59.2 Ma (or 2.4 Myr in duration), and the Gashatan ALMA faunas in Anhui range from 59.2 to 56 Ma (or 3.2 Myr in duration). Given the different durations represented in each of the three time bins used in our analyses, we corrected all variance estimates by dividing the variance calculated in each of the bootstrapped samples by the time duration of the respective time bin. In this manner, the variance values reported in the study represent per-million-year values.
We used pie chart analysis to verify that the proportions of tooth positions in each time bin are not substantially different from each other (
Fig. S1
). However, we caution that time bin comparisons of individual tooth positions are unlikely to be statistically robust because of small sample sizes. We only use aggregates of dental positions (all teeth, molars, or premolars) in our data partition analyses and interpretation.
Quantification and statistical analysis
We used the following features of the dental topography and performance data as the basis for assessing faunal assemblage trait shifts through the Paleocene: trait mean, variance, trait-to-trait correlation, and partition-to-partition correlation. We used ANOVA (Analysis of Variance) and pairwise t test to compare trait means, F test to compare trait variance, linear regression analysis and Kendall’s τ to compare trait-to-trait correlation, and two-block partial least squares (2B-PLS) analysis to compare partition-to-partition correlation. There are a total of six traits forming two main data partitions: topographic partition (DNE, OPCR, Slope, RFI) and performance partition (Compressive SE, and Shear SE). To assess the sensitivity of the results to subsets of the data, all of the trait comparisons were done iteratively using the total dataset, by time bin (early, middle, late Paleocene), taxon (Chinese endemic pantodonts versus non-pantodonts), and/or by dental position (all teeth, molar teeth, premolar teeth). All statistical tests were performed on 1,000 bootstrap resampled datasets that were parameterized using results of sensitivity tests on original versus cast specimen models, finite element mesh convergence tests, and time bin duration comparisons (see previous section). In addition, we quantified tooth size using two measures: total 2D surface area and square root of surface area. The R script for all statistical analyses and plots are included in Data S9.
Statistical resampling and tests
We used bootstrap resampled variance of dental topographic metrics and dental performance variables as a measure of tooth form-function disparity. 1,000 replicates of the 200-specimen DTA-FEA trait datasets were generated by sampling each DTA and FEA trait value from a uniform distribution defined using a +/−40% range of the original model-derived values. The bootstrap resampling was done with replacement, so it was possible for a given DTA/FEA trait value in a sampled tooth model to be repeated in a different replicate, but very unlikely for entire datasets to share similar values with another replicate. We used this resampling scheme to account for the uncertainty in trait estimates introduced by the totality of modeling, specimen preservation, cast versus original, and other potential sources of uncertainty in trait values. For each replicate, variance was calculated for each metric, time interval, for Chinese endemic pantodont (CEP) versus non-pantodont, and molar versus premolar data partitions. To assess shifts through time, statistical differences between the variance of each dental topographic metric sample in adjacent time intervals (A, early Paleocene; B, middle Paleocene; C, late Paleocene) were evaluated using F tests. A null hypothesis of a variance ratio of 1 between pairwise comparisons was tested using the var.test() function in R
91
. The outputs of the variance tests on a given bootstrap sample were then compiled for all 1,000 replicates, and the overall variance mean and variance test output used as the statistical basis for detecting significant differences between time, taxon, and tooth data partitions. Unless indicated otherwise, all tests described below were also done using the 1,000 bootstrap samples.
We evaluated differences in central tendency (mean value) of dental topographic metrics and dental performance variables through time using analysis of variance (ANOVA) and pairwise t tests. Each dental topographic metric was tested against the three time intervals defined above, using the aov() function in R. For statistically significant (at the
p
< 0.05 level) results, we additionally evaluated the pairwise intervals that contribute significant differences in mean dental topographic values. We assessed pairwise differences using pairwise
t
tests implemented with a Holm correction for multiple comparisons. The
t
test was conducted using pairwise.t.test() in R.
We constructed a tooth morphospace using all four dental topographic metrics analyzed by principal components (PC) analysis. The first and second PC axes were chosen to visualize the two-dimensional morphospace. Additionally, we quantified the degree of morphological disparity and statistical differences in disparity between adjacent time interval data partitions. All PC scores generated from the PCA were included in the disparity analysis. The prcomp() function in R was used for PCA, and the morphol.disparity() function implemented in the Geomorph R package
92
was used for morphological disparity significance tests. Input data for the PCA were from the original dataset values, not from the bootstrap samples.
Linear regression analysis between individual dental topographic metric (DNE, OPCR, Slope, RFI) and dental performance metric (compressive bite strain energy, shear bite strain energy) was performed to quantify the correlation between dental form and function. Adjusted
R
2
and
p
values generated from the lm() function in R were used to evaluate the goodness of fit and statistical significance of the form-function relationships. The distribution of
R
2
values and their corresponding
p
values are reported in
Fig. S6
.
In addition to pairwise form-function linear regression analyses, we also evaluated the degree of correlation between the DTA and FEA data blocks as a means to measure covariation between dental topography and deformation resistance. We used two-block partial least squares analysis
93
coupled with bootstrap resampling to generate distributions of correlation coefficients (
r-pls
) for each of the three time bins, and then tested for significant differences in the magnitude of DTA-FEA correlation between adjacent time bins using Welch’s two-sample t tests on the correlation coefficient distributions. DTA-FEA correlation differences at
p
< 0.05 are interpreted as a significant shift in the degree of covariation of the two traits from one time bin to the next time bin.
All R scripts used in the analyses are included as supplementary files (Data S8, S9).
Resource availability
Requests for further information and resources should be directed to and will be fulfilled by the lead contact, Jack Tseng (
zjt@berkeley.edu
).
Code associated with analyses is included with this article.
Raw data are available in the supplementary materials.
All original fossil specimens are accessioned in the Institute of Vertebrate Paleontology and Paleoanthropology, Chinese Academy of Sciences.
Supplemental Document
Field locality information
The extensive development and conversion of outcrops in the Nanxiong Basin into agricultural fields has created a ‘race against time’ to document and study this critical area to understand placental evolution. Clyde et al.
94
estimated that 20 out of 54 early and middle Paleocene fossil sites in the Nanxiong Basin have already been destroyed by infrastructural and housing developments since their original discovery nearly three quarters of a century prior. Our re-survey of the key fossil sites during a trip there in 2023 suggests that the majority of the sites, except for the K-Pg boundary locality, which is protected by municipal historic landmark designation, are now inaccessible or completely obliterated. This reality means that the mammalian fossil samples analyzed in this study offer an ever more important and rare window into earliest mammal life during the ‘Age of Mammals.’ Our analyses are based on the most complete earlier Paleocene materials currently recovered from the Asian continent.
Isotope analyses show that average δ
13
C values returned to pre K-Pg levels from a short-duration 2 ppm (part per mil) decrease about 1 Myr into the Paleocene in the Nanxiong Basin, congruent with global patterns of rapid mammal taxonomic recovery
94
. Although the majority of Paleocene fossiliferous localities are within the classic ‘red beds’ of south China, interbedding with limestone-like layers may indicate localized cycles of dry and humid intervals
95
. Fossil pollen in the Nanxiong Basin indicates warm climates throughout the Paleocene time interval; however, a notable shift in higher percentages of ferns and gymnosperms and lower percentage of angiosperms is observed in the late Paleocene
96
, indicating local recovery of gymnosperms and ferns (
Table S2
).
The antipodal location of the Nanxiong Basin from the Yucatan Peninsula makes the geochemical identification of a K-Pg boundary layer difficult. Arguments for the precise location of the K-Pg boundary layer has been made on the basis of iridium enrichment in dinosaur egg shells
97
and with total mercury content that correlates with known timing of Deccan Traps volcanism
98
. Regardless of the precise stratigraphic level of the K-Pg boundary in the Nanxiong Basin, the specimens we included in our analyses have all been collected in higher stratigraphic levels that are biostratigraphically unambiguous as Paleocene sequences
96
. Planned fieldwork at and around the putative K-Pg boundary sections will sample micromammal fossils towards the objective of constructing a refined biostratigraphic framework for high-resolution analysis of the first million years of post-K-Pg mammal recovery. At this time, high-resolution data are not available to test the precise rate at which Paleocene Asian mammal taxonomic disparity and size disparity recovered/stabilized.
Evolutionary preconditions for the post-K-Pg placental radiation
Ting et al.
99
described an
in situ
faunal turnover event in southern China between the early and middle Paleocene and a gentle decrease in endemic taxa. Such a faunal change did not amount to shifting dental topographic mean values, although it is correlated with increased variability in all topographic traits (
Fig. 1
). Similar inferences of ecological stasis were made by Clyde et al.
100
. The replacement of some archaic taxa with more cosmopolitan ones is consistent with an evolutionary ‘training ground’ phenomenon where taxa preadapted to local environmental conditions were at a selective advantage to disperse into new geographic regions when global climate changed
101
. Hooker
102
makes the observation that late Paleocene North American and European mammal assemblages responded to the late Paleocene thermal maximum by increasing browsing herbivory and terrestrial taxa; this increase is at the expense of arboreal taxa in the European samples analyzed in that study. The observed DTA shifts in our dataset are consistent with this trend (
Fig. 2
). In the final Paleocene time bin, immediately prior to the faunal turnover that coincided with the Holarctic mammalian dispersal event and the PETM (Paleocene-Eocene Thermal Maximum), increased seasonal aridity in southern China (based on pollen composition) correlated with increased disparity and maxima of dental topographic metrics (
Fig. 2
).
The majority of research into post-K-Pg mammal recovery come from North American sites, which represent ∼80% of known terrestrial K-Pg boundary sections
103
. By contrast, Asian K-Pg sites represent only ∼3% of K-Pg boundary sections. There are no Paleocene fossil mammal assemblages known from the Indian subcontinent
104
. Europe is similarly problematic in terms of both the paucity of well-dated K-Pg sites as well as correlated or thick stratigraphic sections that permit research into post-K-Pg dynamics
105
. Additionally, the oldest well-sampled Cenozoic mammal fauna in Europe is late early to middle Paleocene in age. This absence of earliest Paleocene data renders the study of mammalian evolutionary dynamics from the K-Pg to end-Paleocene hyperthermal event in Europe difficult
106
. Thus, no dental form-function comparisons are possible between the Asian and European post-K-Pg mammal recovery patterns for the entire Paleocene time interval.
Bayesian analyses of Paleogene mammal faunas suggest that a zoogeographic barrier between the Arabian Peninsula and the rest of Asia was present and prevented faunal interchange until the end-Oligocene
104
. Thus, the corridors of dispersal and interchange for the southern Chinese Paleocene mammals at the end-Paleocene were constrained to the north, towards the Mongolian Plateau, or to the south towards India. The absence of Paleocene Indian fossil mammals prevents a characterization of the extent to which the ecomorphological patterns described in this study also applies more broadly to fossil mammals further to the south. Based on the establishment of a land connection between Asia and India during the Paleogene, similarity in ecomorphological patterns might be expected
107
. By contrast, the well-known Paleocene-Eocene stratigraphic sequence and fossil record on the Mongolian Plateau clearly document the northward expansion of early Paleocene southern Asian taxa and the increased faunal similarity with other continents
108
during time intervals immediately following those analyzed in this study.
Absence of latitudinal gradients in Paleocene mammal taxonomic richness despite modern level temperature gradients across western interior North America suggests potential ecological instability in that region around the time of the mammalian dispersal to North America
109
. However, other analyses suggest that arrival of Eurasian immigrants to North America at the Paleocene-Eocene Thermal Maximum did not drastically alter functional diversity in the local communities
110
. Establishment of latitudinal floral gradients and the high mammal endemism in east Asia during the same time period
111
may have allowed ecological stability to establish earlier in Asia compared to North America. The stability of a large landmass in Asia for much of the Mesozoic and Cenozoic likely also contributed to the development of climate-adapted faunas in south Asia leading up to the PETM and expansion of suitable warm habitats for the southern taxa
112
. Data presented here suggest that adaptations of endemic east Asian mammals to global and regional environmental changes in the critical 10 Myr period immediately following the K-Pg extinctions can be understood as priming the evolutionary pump for the origin, radiation, and dispersal of modern mammal orders.
Summary of levels of topography-performance associations
(1) Correlation plot patterns (
Fig. 3
): We performed correlation plot comparisons on combined DTA and FEA data, using Kendall’s τ as a measure of the strength of correlation. Contingency tables show that DNE/OPCR to compress SE/shear SE correlations increased from early to middle then late Paleocene (
Fig. 3
). Compared to the steady increase in integration shown by two-block PLS analyses (see below), this suggests that dental complexity and convexity were disproportionately driving the overall integration patterns, whereas cusp height and sharpness were very weakly associated to compressive and shear strain energy values.
We additionally conducted correlation analyses across time using data partitions representing individual tooth positions (
Figs. S9
-
S11
) to verify the overall trend observed using the total dataset (
Fig. 3
). Upper M1 patterns generally reflect the trend recovered from analysis of the overall dataset, but M2 and M3 results display inconsistent DTA-FEA correlations, possibly due to small sample sizes. Lower molar patterns generally replicate those recovered in the overall analyses, but lower M1 and M2 signals appear to be stronger than those for lower M3. Finally, low sample sizes make premolar-specific correlations unstable, with general pattern showing EP-MP strengthening then MP-LP stasis or weakening.
(2) Per-time variance patterns (
Figs. S3
-
S5
): The overall dataset showed steady increase in DNE and OPCR variance, differing from the middle Paleocene peak pattern seen in the RFI, Slope, Compressive SE, and Shear SE variances. The non-pantodont partition shows a more consistent pattern between DTA and FEA variances, with all traits showing a middle Paleocene spike. Lastly, the CEP data partition shows even more mosaic patterns than the overall data partition. CEP DNE, OPCR, and Slope show variance increases over time, whereas Slope and compressive SE exhibit a middle Paleocene spike. Shear SE shows a steady decline in variance over time. The disaggregated molar and premolar data partitions do not contain large sample sizes; thus, we caution against over-interpreting the finer patterns until a statistical more robust sample can be analyzed. The per-tooth position analyses, although broadly supporting the early-middle Paleocene trends for both DTA and FEA data (and for FEA data in general across all time intervals), provide lower support for the middle-late Paleocene trends. Support is lowest when RFI and Slope values are analyzed by tooth position. In addition to the smaller sample sizes included in these partitioned analyses, this result may indicate that different tooth positions may record somewhat different, sometimes opposing, DTA signals but consistent FEA signals. This suggests structure-performance decoupling at the tooth position level. Similar differences between the pooled sample results and per-tooth trends when using range length (maximum trait value – minimum trait value for a given data partition) are recovered (
Fig. S5B
,
5D
).
(3) Trait correlation patterns (
Figs. S6
-
S7
): To more precisely examine the relationships between pairs of DTA and FEA traits, we performed pairwise linear regression analyses using bootstrapped sample estimates of trait values. The outputs show that the 2B-PLS results below are mainly driven by association between higher DNE and OPCR with lower compressive and shear SE (
Fig. S5
). This association is particularly strong in premolar partitions and less strong in molar partitions (
Fig. S6
), and doesn’t appear to represent differences between CEPs and non-pantodonts overall. When examined through time, there does seem to be a difference in how strongly DTA-FEA are associated; the spikes in Compressive and Shear SE values in the middle Paleocene time bin is not mirrored in DNE and OPCR values in the same time interval, suggesting a breakdown during middle Paleocene of the DTA-FEA relationship established in the early Paleocene. This result specifically mirrors findings from the CEP all-teeth data partition and non-pantodont molar partition 2B-PLS analysis (see below).
(4) Two-block partial least squares (2B-PLS) patterns (
Table S1
): The overall dataset exhibited a steady increase in
r
coefficient values from the early to the late Paleocene, indicating strengthening DTA-FEA integration over time. The CEP data partition showed a dip in integration in the middle Paleocene in the all-teeth partition, a steady decrease for premolar partitions, but the opposite pattern (a spike) in the molar partition. Non-pantodonts show a different pattern, where all-teeth and premolar partitions spike in integration during the middle Paleocene, whereas the molar partition dips in the middle Paleocene.
Sensitivity analyses of tooth size trends
Tooth disparity was highest during the early Paleocene time interval of our dataset; this is consistent both using variance and range length as the disparity measure (
Fig. S8
). The overall decrease in size disparity and variance across the Paleocene based on the total dataset was additionally tested in individual tooth position partitions (
Table S3
). The overall disparity trends are also observed in premolar and upper molar data partitions, whereas overall tooth size trends are observed mainly in the lower premolar 4 data partition. Decrease in mean tooth size is most consistently observed across multiple tooth partitions for the early Paleocene to late Paleocene comparison (and less clearcut for early-middle and middle-late Paleocene comparisons, respectively). Shifts during the middle Paleocene are variably supported depending on tooth position analyzed. Given that the middle Paleocene is represented by the smallest sample size, the uncertainty surrounding per-tooth position trends during this time period may be explained by the low sample available for this study.
Sample and methodological limitations
The highly fragmentary nature of early Cenozoic mammal fossils in Asia means that even the best preserved faunas studied herein contain substantial missing information. First, the absence of a high-resolution chronological framework prevents the fossil data from being analyzed on a continuous time axis; the binning of the samples into three main intervals within a 10-million-year period hinders additional hypotheses about the environmental and climatic correlations of the dental structure-performance results presented. Second, the uneven sampling of the available mammalian assemblage throughout the Paleocene sites in China limits the breadth of ecomorphological categories included in the analyses; rarer taxa representing potentially more specialized carnivore, insectivore, or herbivore forms were not included in our sampling. Third, the spatial discontinuity of stratigraphically younger (Eocene) and older (Cretaceous) mammal assemblages means that body size and ecomorphological shifts bracketing the Paleocene cannot currently be analyzed across the sampled basins alongside the dataset presented. These limitations should be considered when interpreting the findings reported in the study.
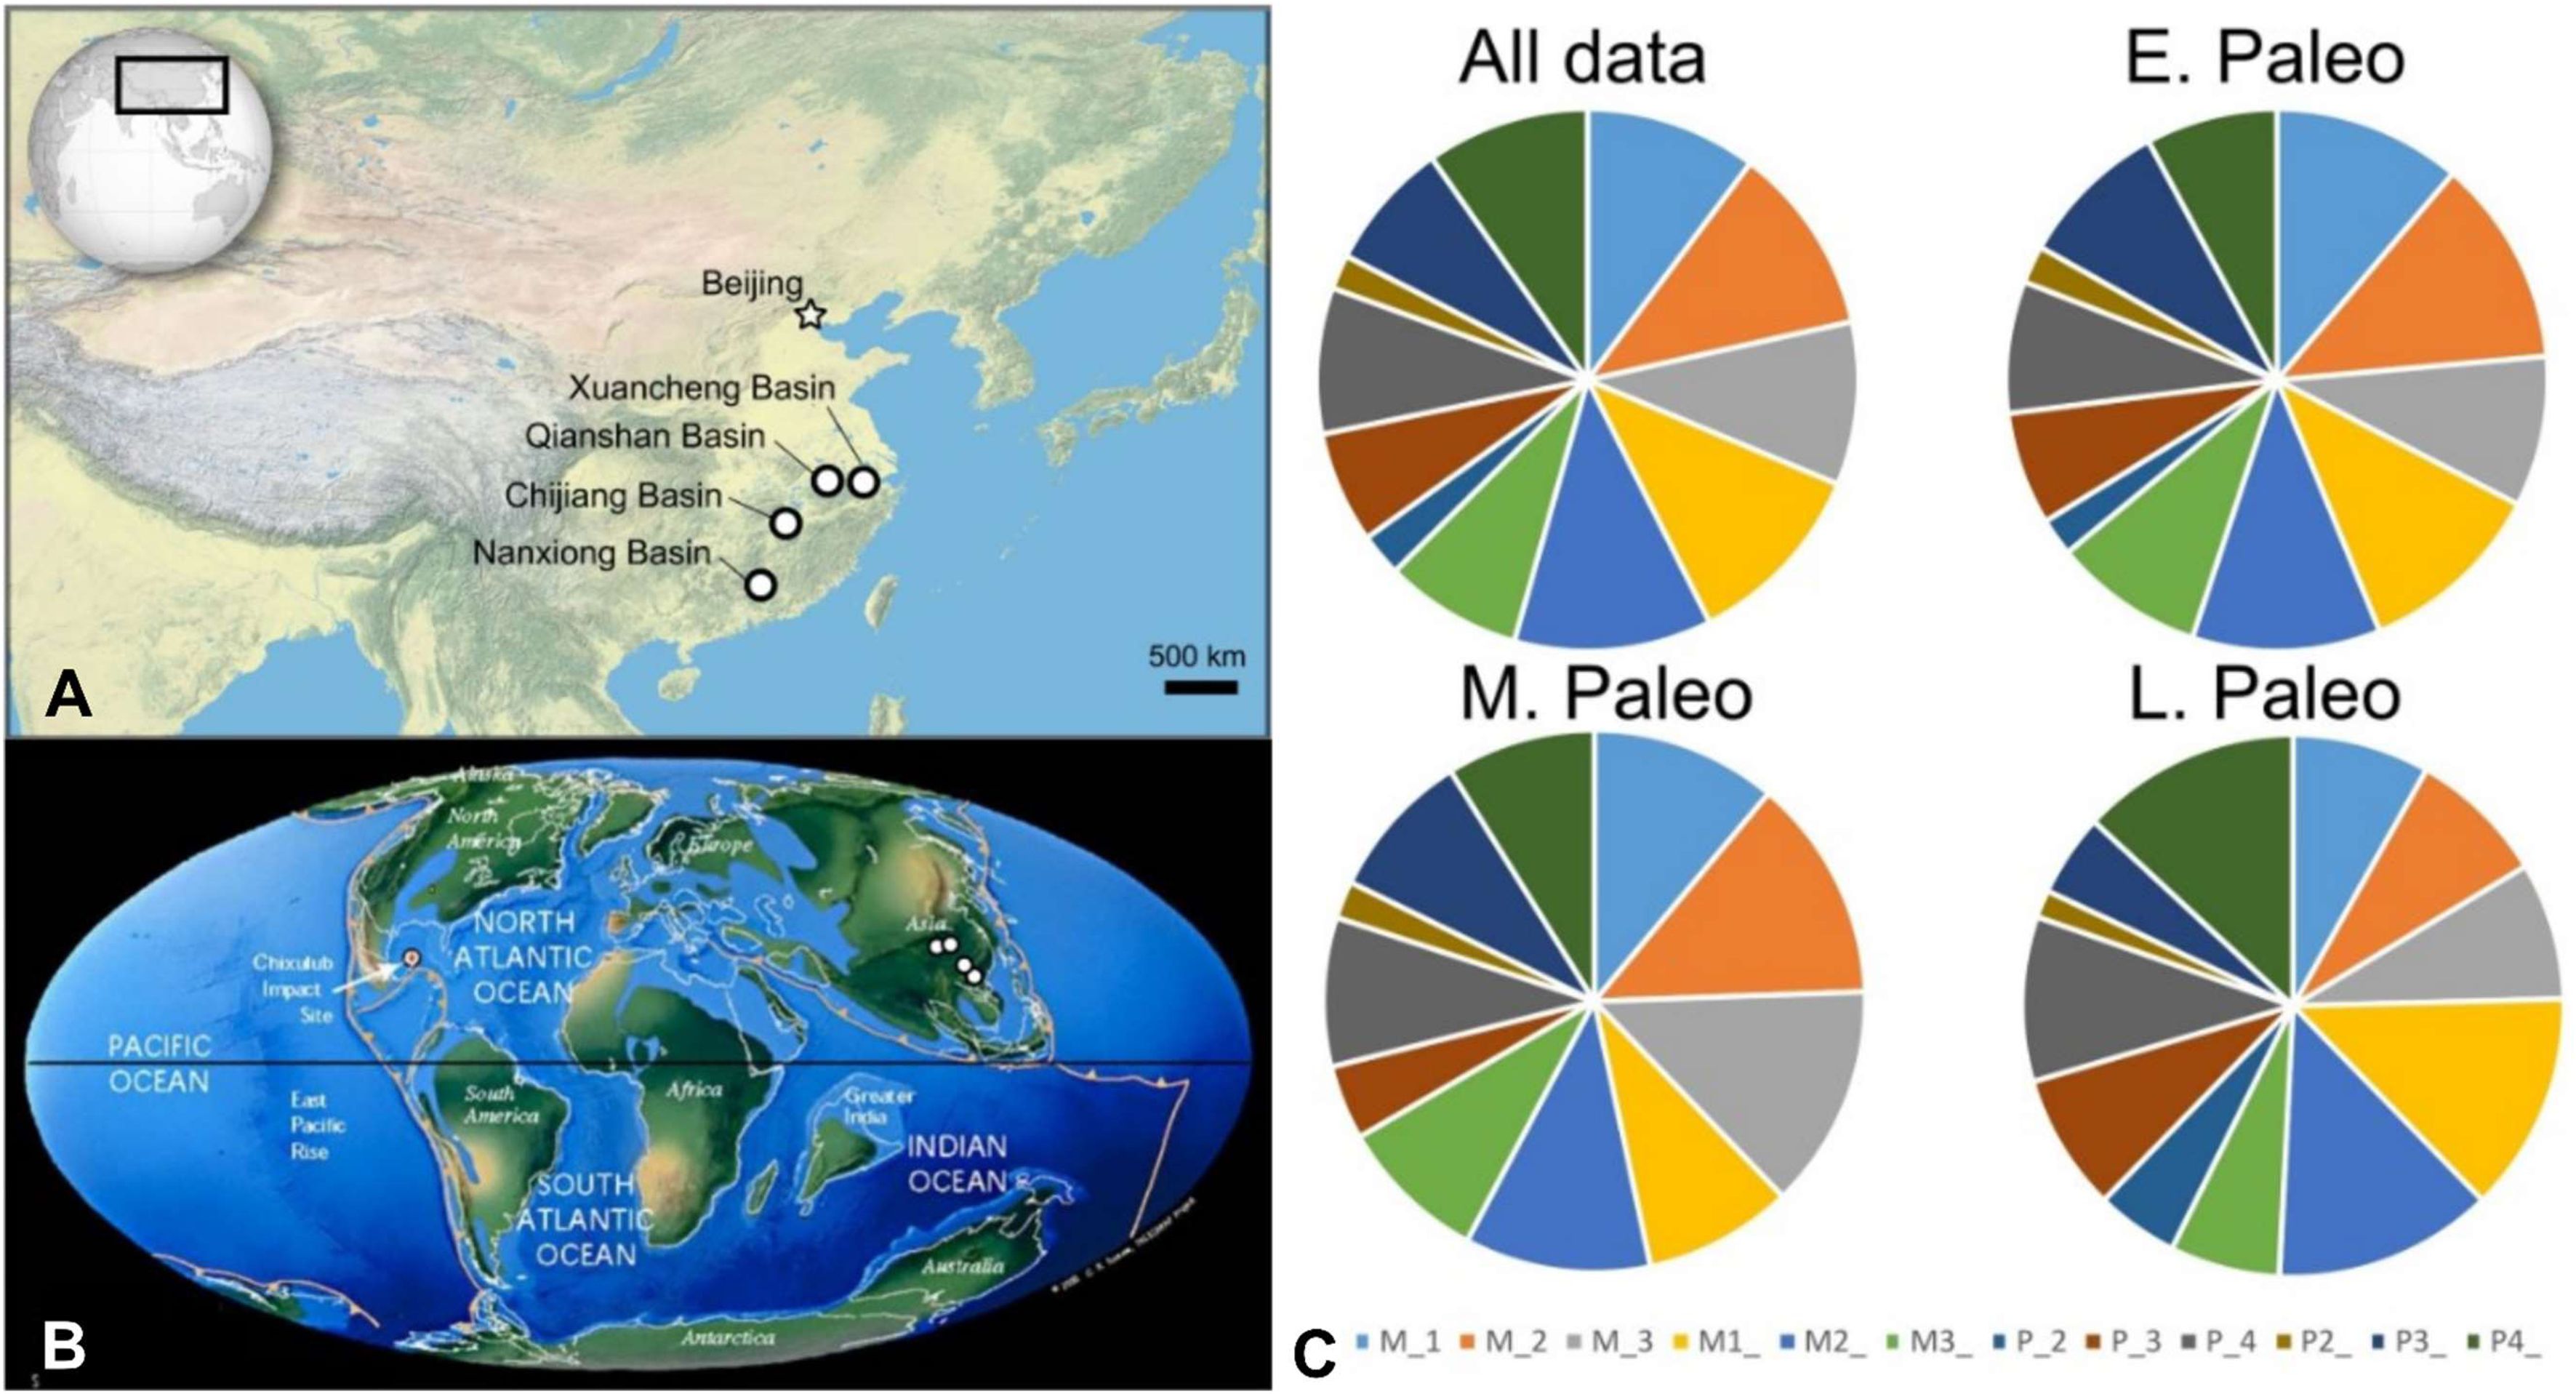
Maps of the fossil locality areas and proportions of teeth analyzed, related to
Fig. 1
.
The Paleocene sedimentary basins sampled are indicated on a modern satellite image (
A
) and on a paleogeographic map of the K-Pg transition (
B
). Satellite map from NASA (
) and paleogeographic map from C. Scotese (
)
113
.
C
. Proportions of tooth positions present in data partitions. M_1-M_3, lower first to third molars; M1_-M3_, upper first to third molars; P_2-P_4, lower second to fourth premolars; P2_-P4_, upper second to further premolars; E, early, M, middle, L, late. The middle Paleocene partition has no P_2 sampled, but otherwise the proportions of tooth positions present in each time interval are generally similar to each other.
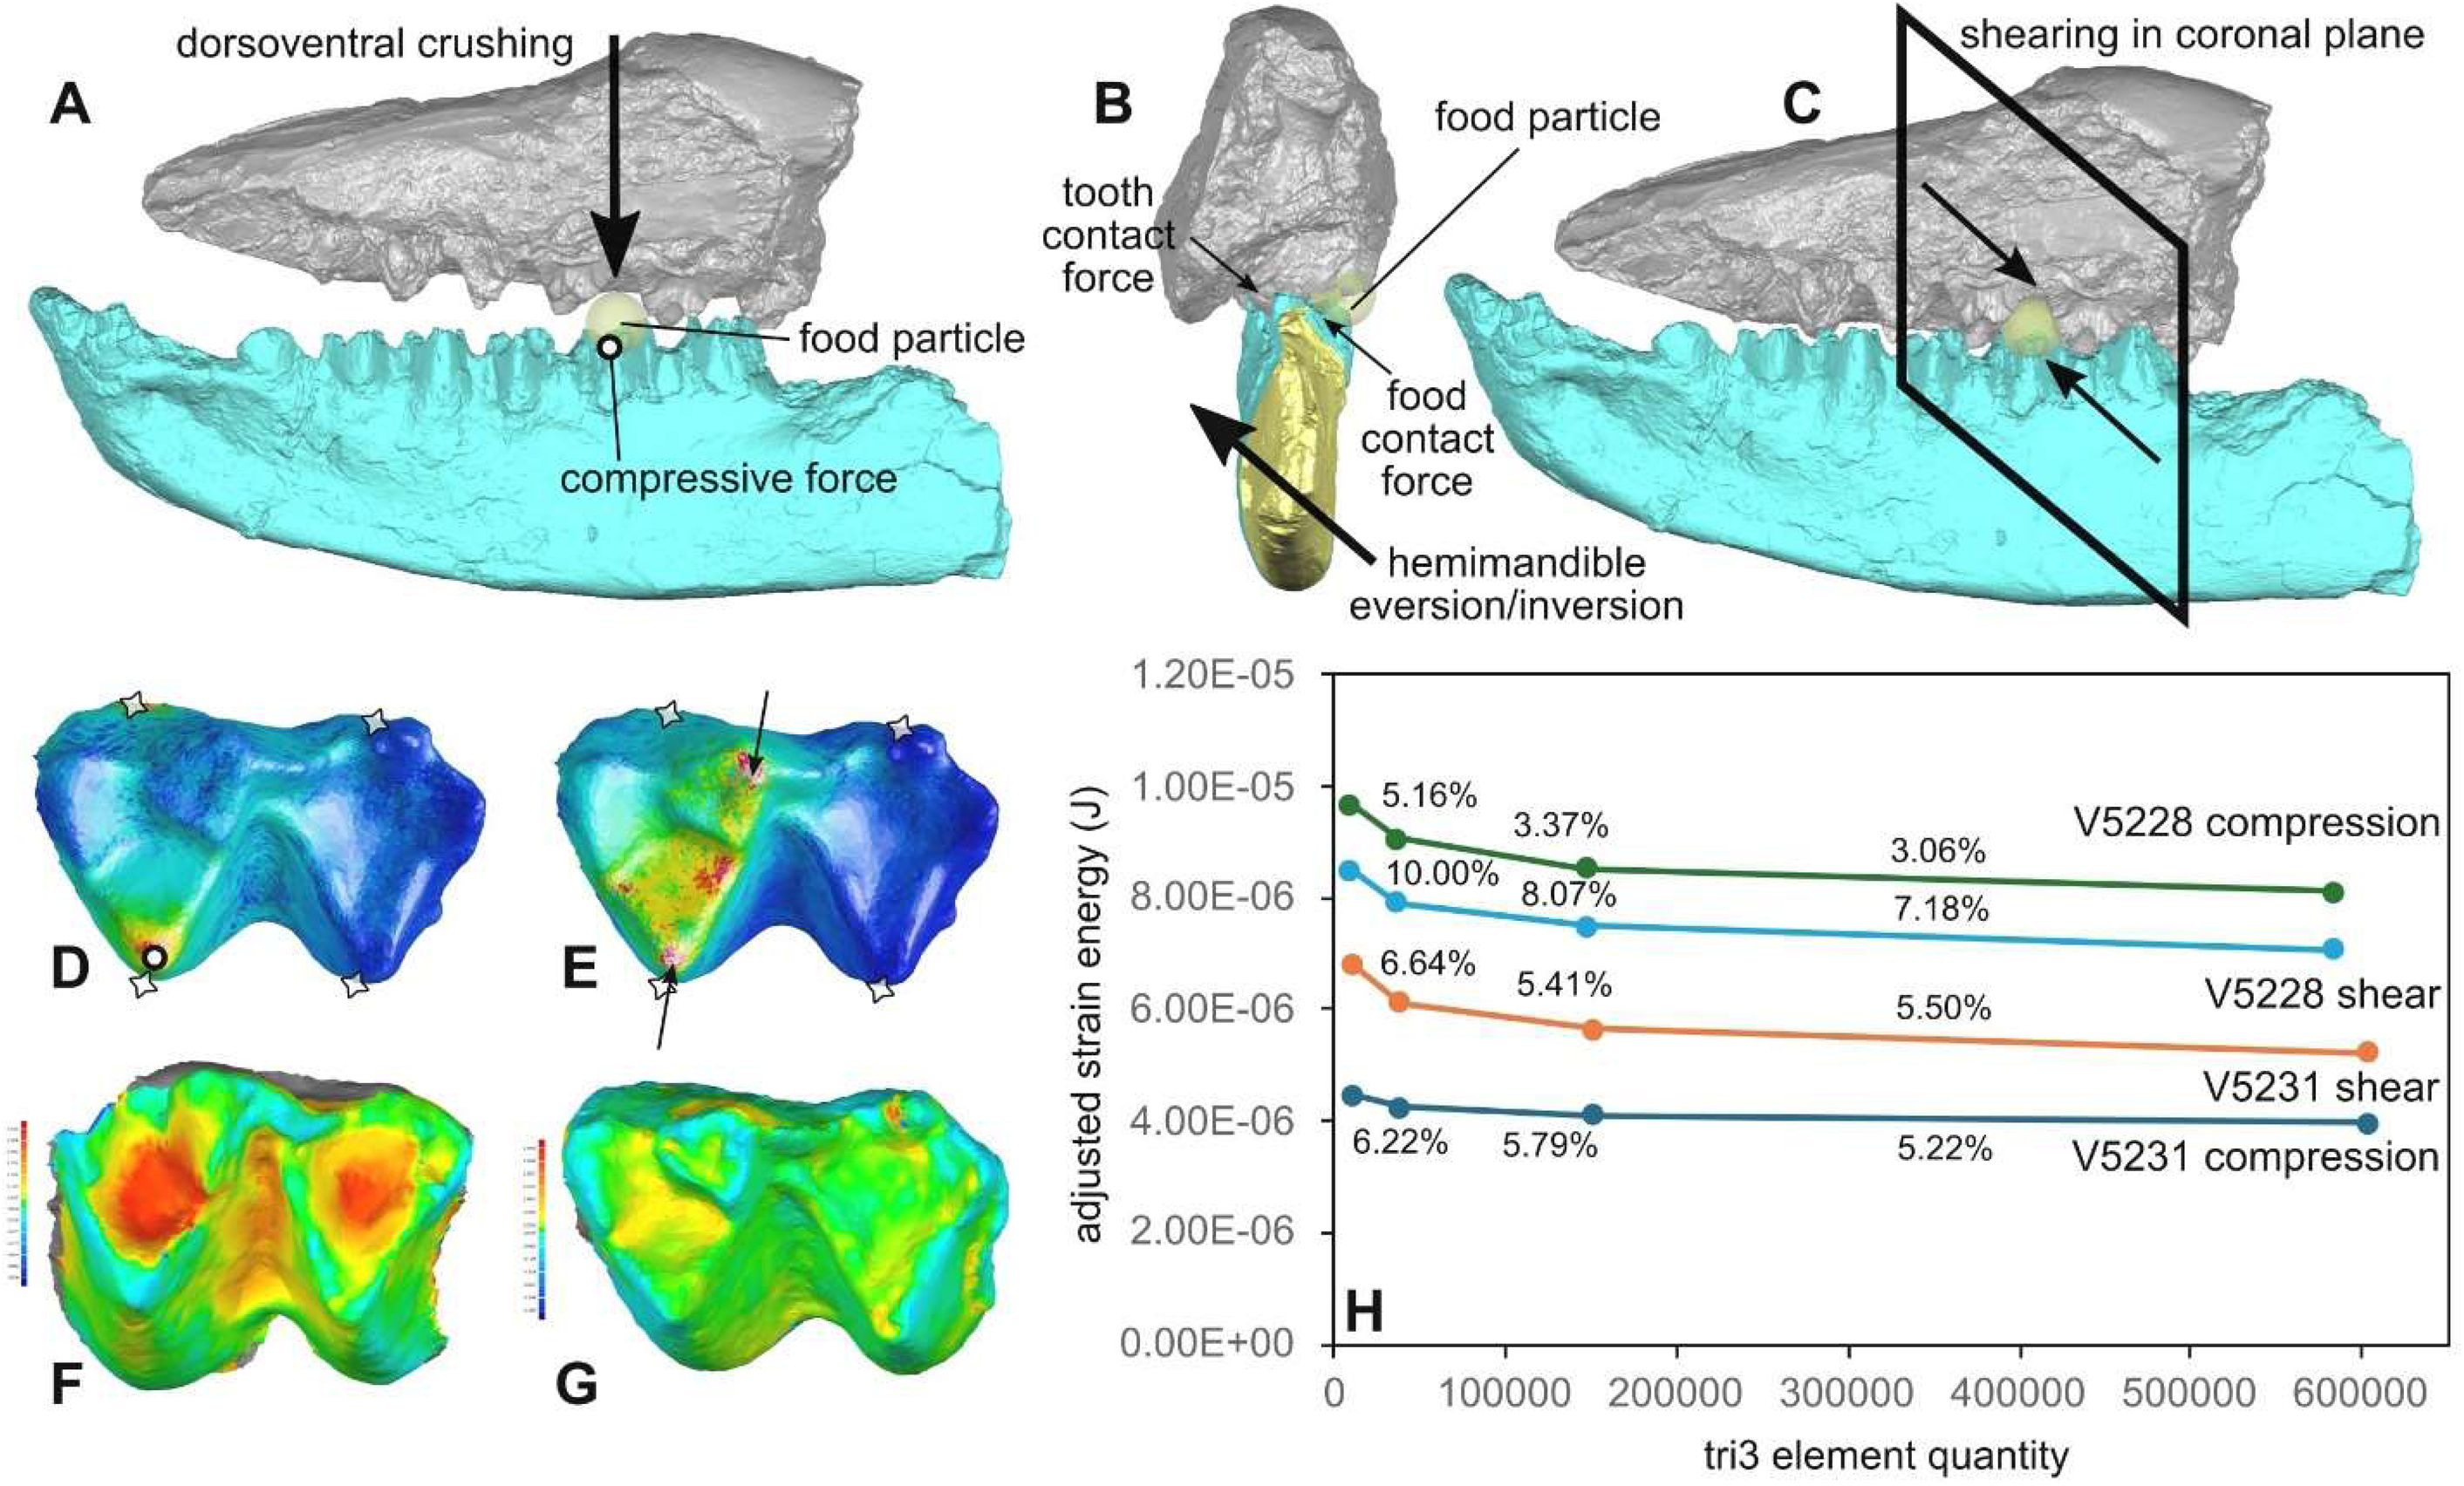
Finite element modeling boundary conditions and convergence tests, related to
Figs. 1
and
3
.
(
A
) Depiction of compressive/crushing force imposed on a lower molar cusp in a specimen of
Guichilambda zhaii
(IVPP V12037) in lateral view. (
B
) Depiction of shearing motion during hemimandible eversion/inversion cycle in coronal view. (
C
) Depiction of shearing motion in lateral view. (
D
) Boundary conditions of compressive bite simulations on the lower first molar of
Altilambda tenuis
(IVPP V5231). (
E
) Boundary conditions of shearing bite simulations on
A. tenuis
. Nodal constraints are indicated by stars, compressive force by circle, and shearing forces by black arrows. (
F
) Three-dimensional deviation map of the first lower molar of
Altilambda pactus
(IVPP V5228) comparing geometric difference between models built form original versus cast-derived image data; positive (red) and negative (blue) deviation maxima +/− 0.58 mm. (
G
) Three-dimensional deviation map of the first lower molar of
Altilambda tenuis
(IVPP V5231), positive (red) and negative (blue) deviation maxima +/− 0.39 mm. (
H
) Convergence test of adjusted strain energy values (in Joules) of compression and shear bite simulations in IVPP V5228 and V5231. Percentage values indicate differences between adjacent model quantities (measured in number of three-noded triangular [tri3] elements). All model values at the lowest quantity models are considered converged based on a <=10% threshold criterion.
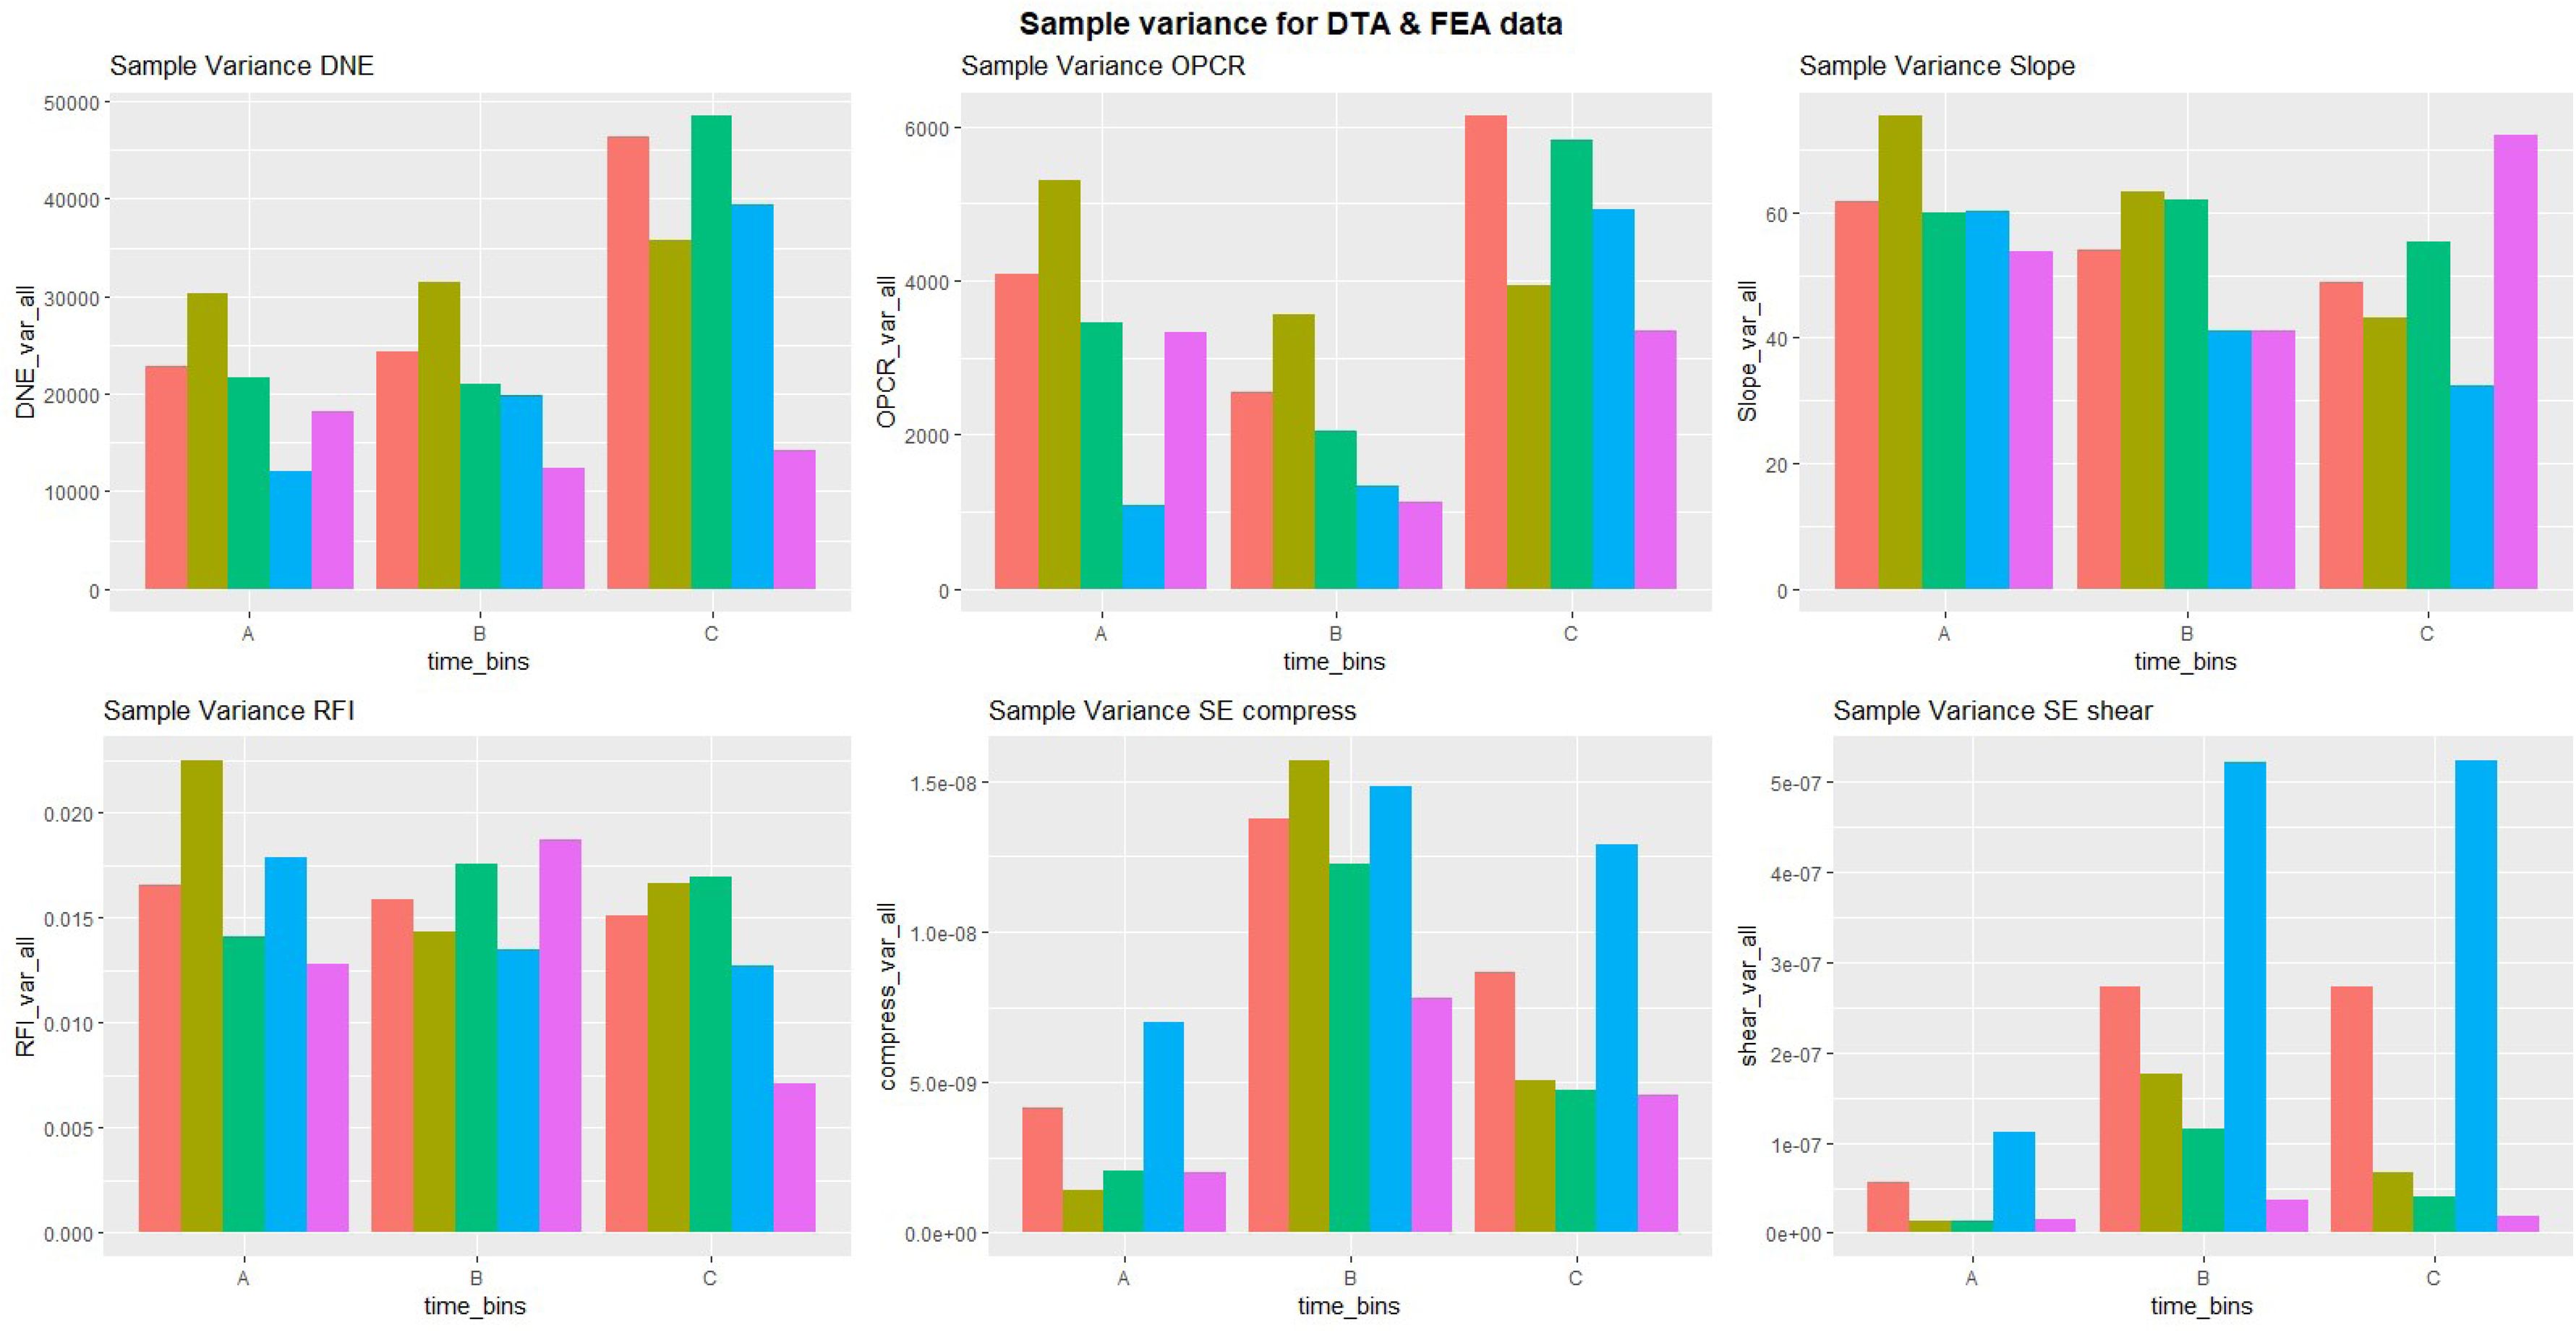
Sample variance (in squared units of each metric) of dental topographic metrics and dental performance traits for the overall dataset, related to
Fig. 1
.
Time bins refer to the early Paleocene (Bin A), middle Paleocene (Bin B), and late Paleocene (Bin C). Color bars represent different data partitions: all data (salmon), all molars (teal), all premolars (green), lower molars (blue), and upper molars (purple).
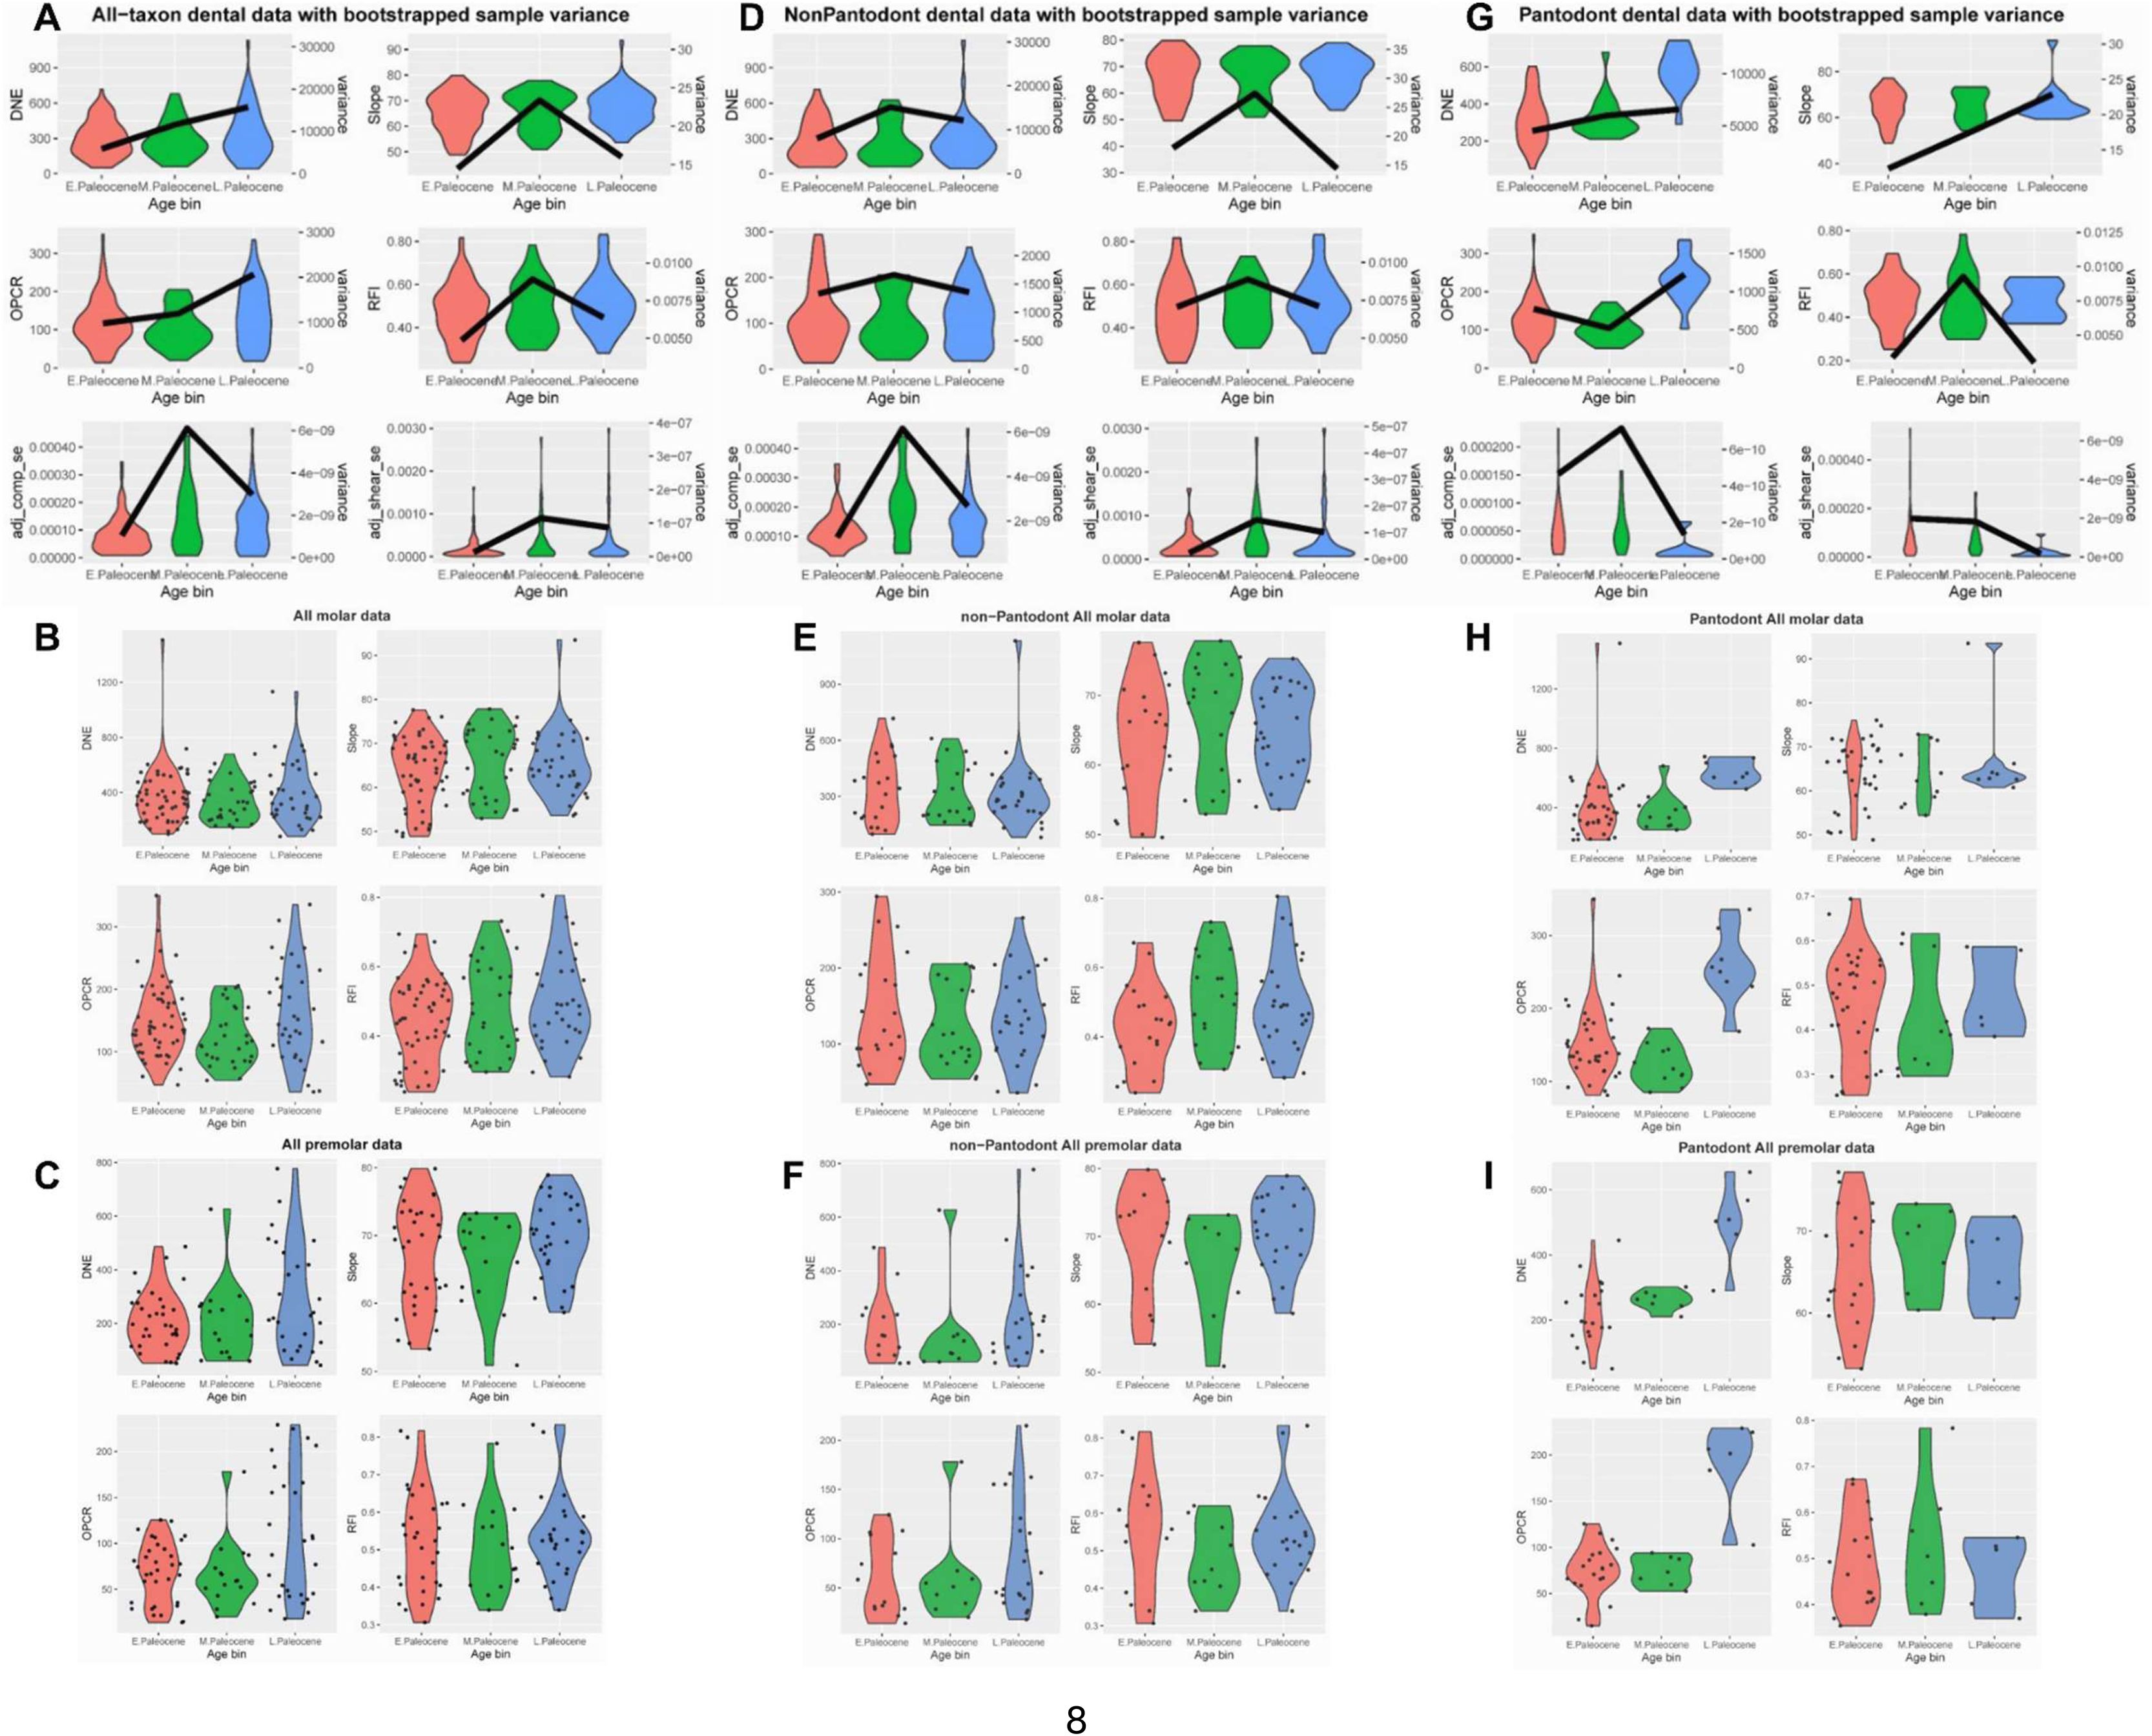
Boxplots of dental topographic and finite element simulated traits, related to
Table 1
.
Dark lines in panels A, D, and G denote sample variance per million years, calculated from 1,000 bootstrap samples of trait values pulled from uniform distributions within their estimated uncertainty ranges. The variance magnitudes are scaled to the duration of the Asian land mammal ages representing each time interval. (
A
) DTA (DNE, OPCR, Slope, RFI) and FEA (compressive bite strain energy, shear bite strain energy) boxplots representing the all tooth positions in the all-taxon partition (
B
) DTA metrics for the molar partition of all taxa. (
C
) DTA metrics for the premolar partition of all taxa. (
D
) DTA and FEA boxplots of all tooth position in the non-pantodont data partition. (
E
) DTA metrics for molars in the non-pantodont data partition. (
F
) DTA metrics for premolars in the non-pantodont data partition. (
G
) DTA and FEA boxplots of all tooth positions in the Chinese endemic pantodont (CEP) partition. (
H
) DTA metrics for molars in the CEP partition. (
I
) DTA metrics for premolars in the CEP partition.
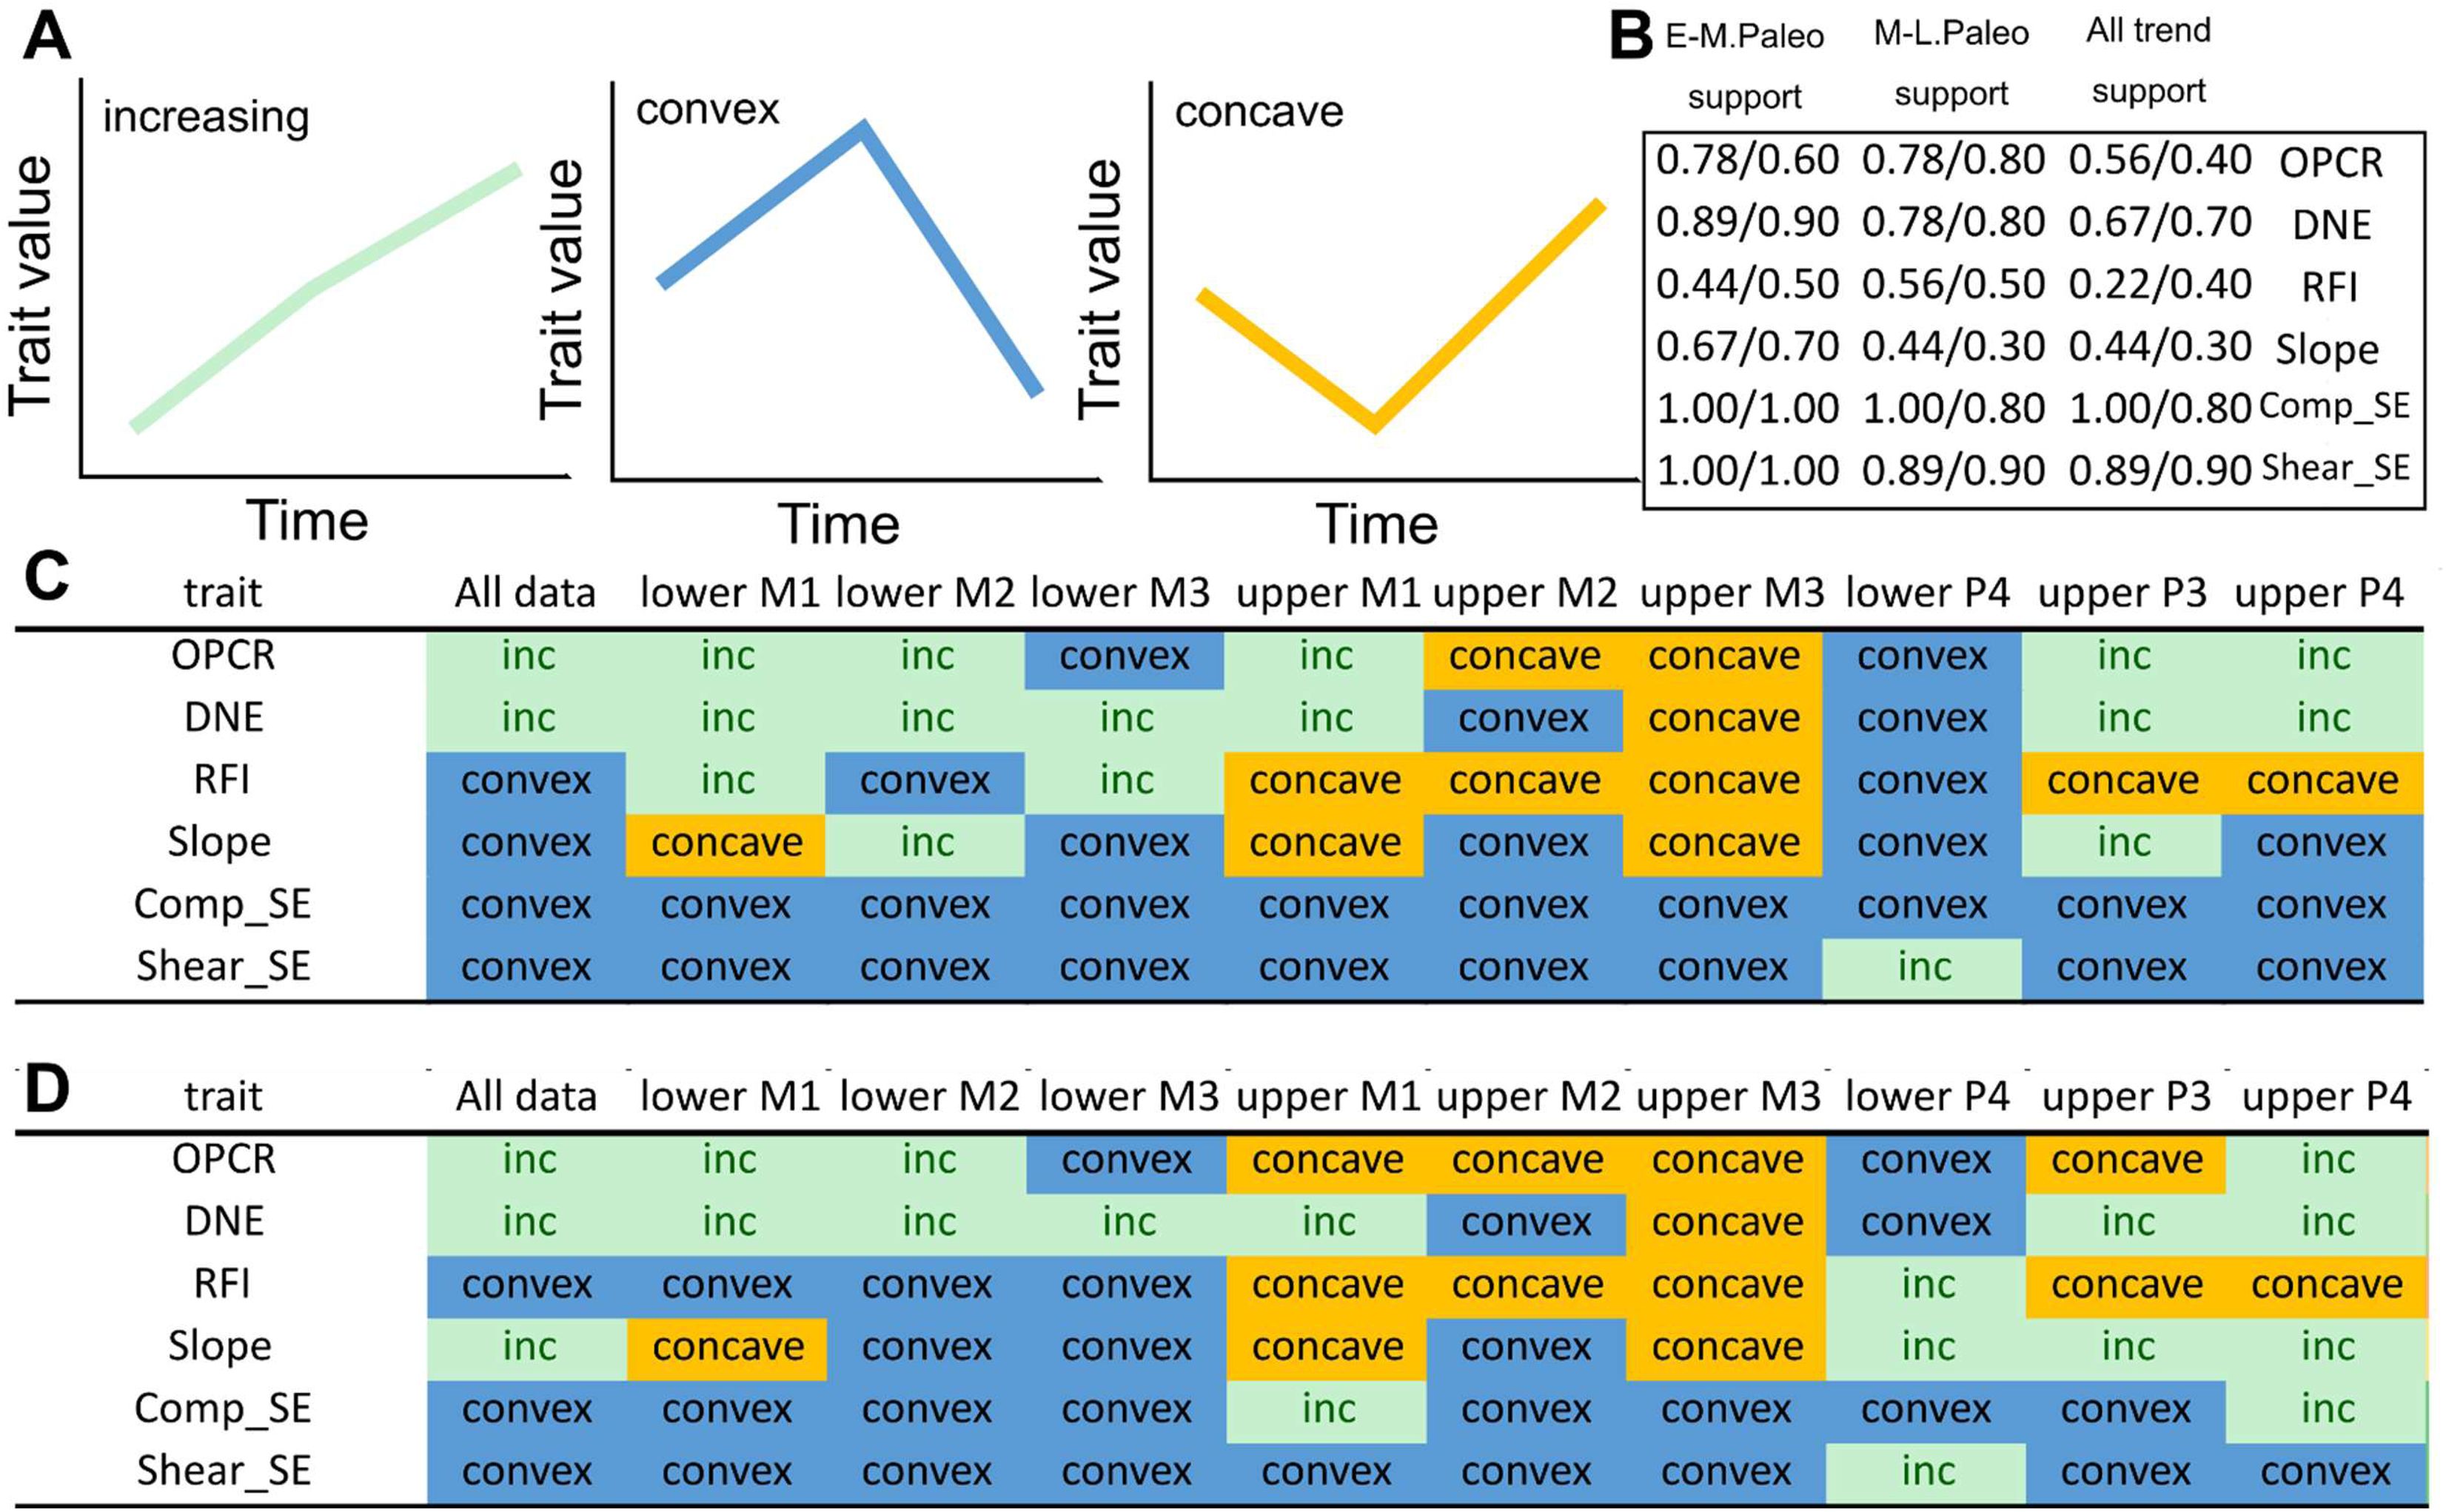
Trends through time for DTA and FEA traits by tooth position, related to
Fig. 1
.
(
A
) Categories of major trends observed through the three Paleocene time intervals. (
B
) Proportion of individual tooth position analyses that support the trend observed in the overall dataset. The first set of values are per-tooth variance; the second set of values are from pooled sample and per-tooth range lengths. (
C
) Individual tooth position variance trends in DTA and FEA trait values. (
D
) Individual tooth position range length trends in DTA and FEA trait values.
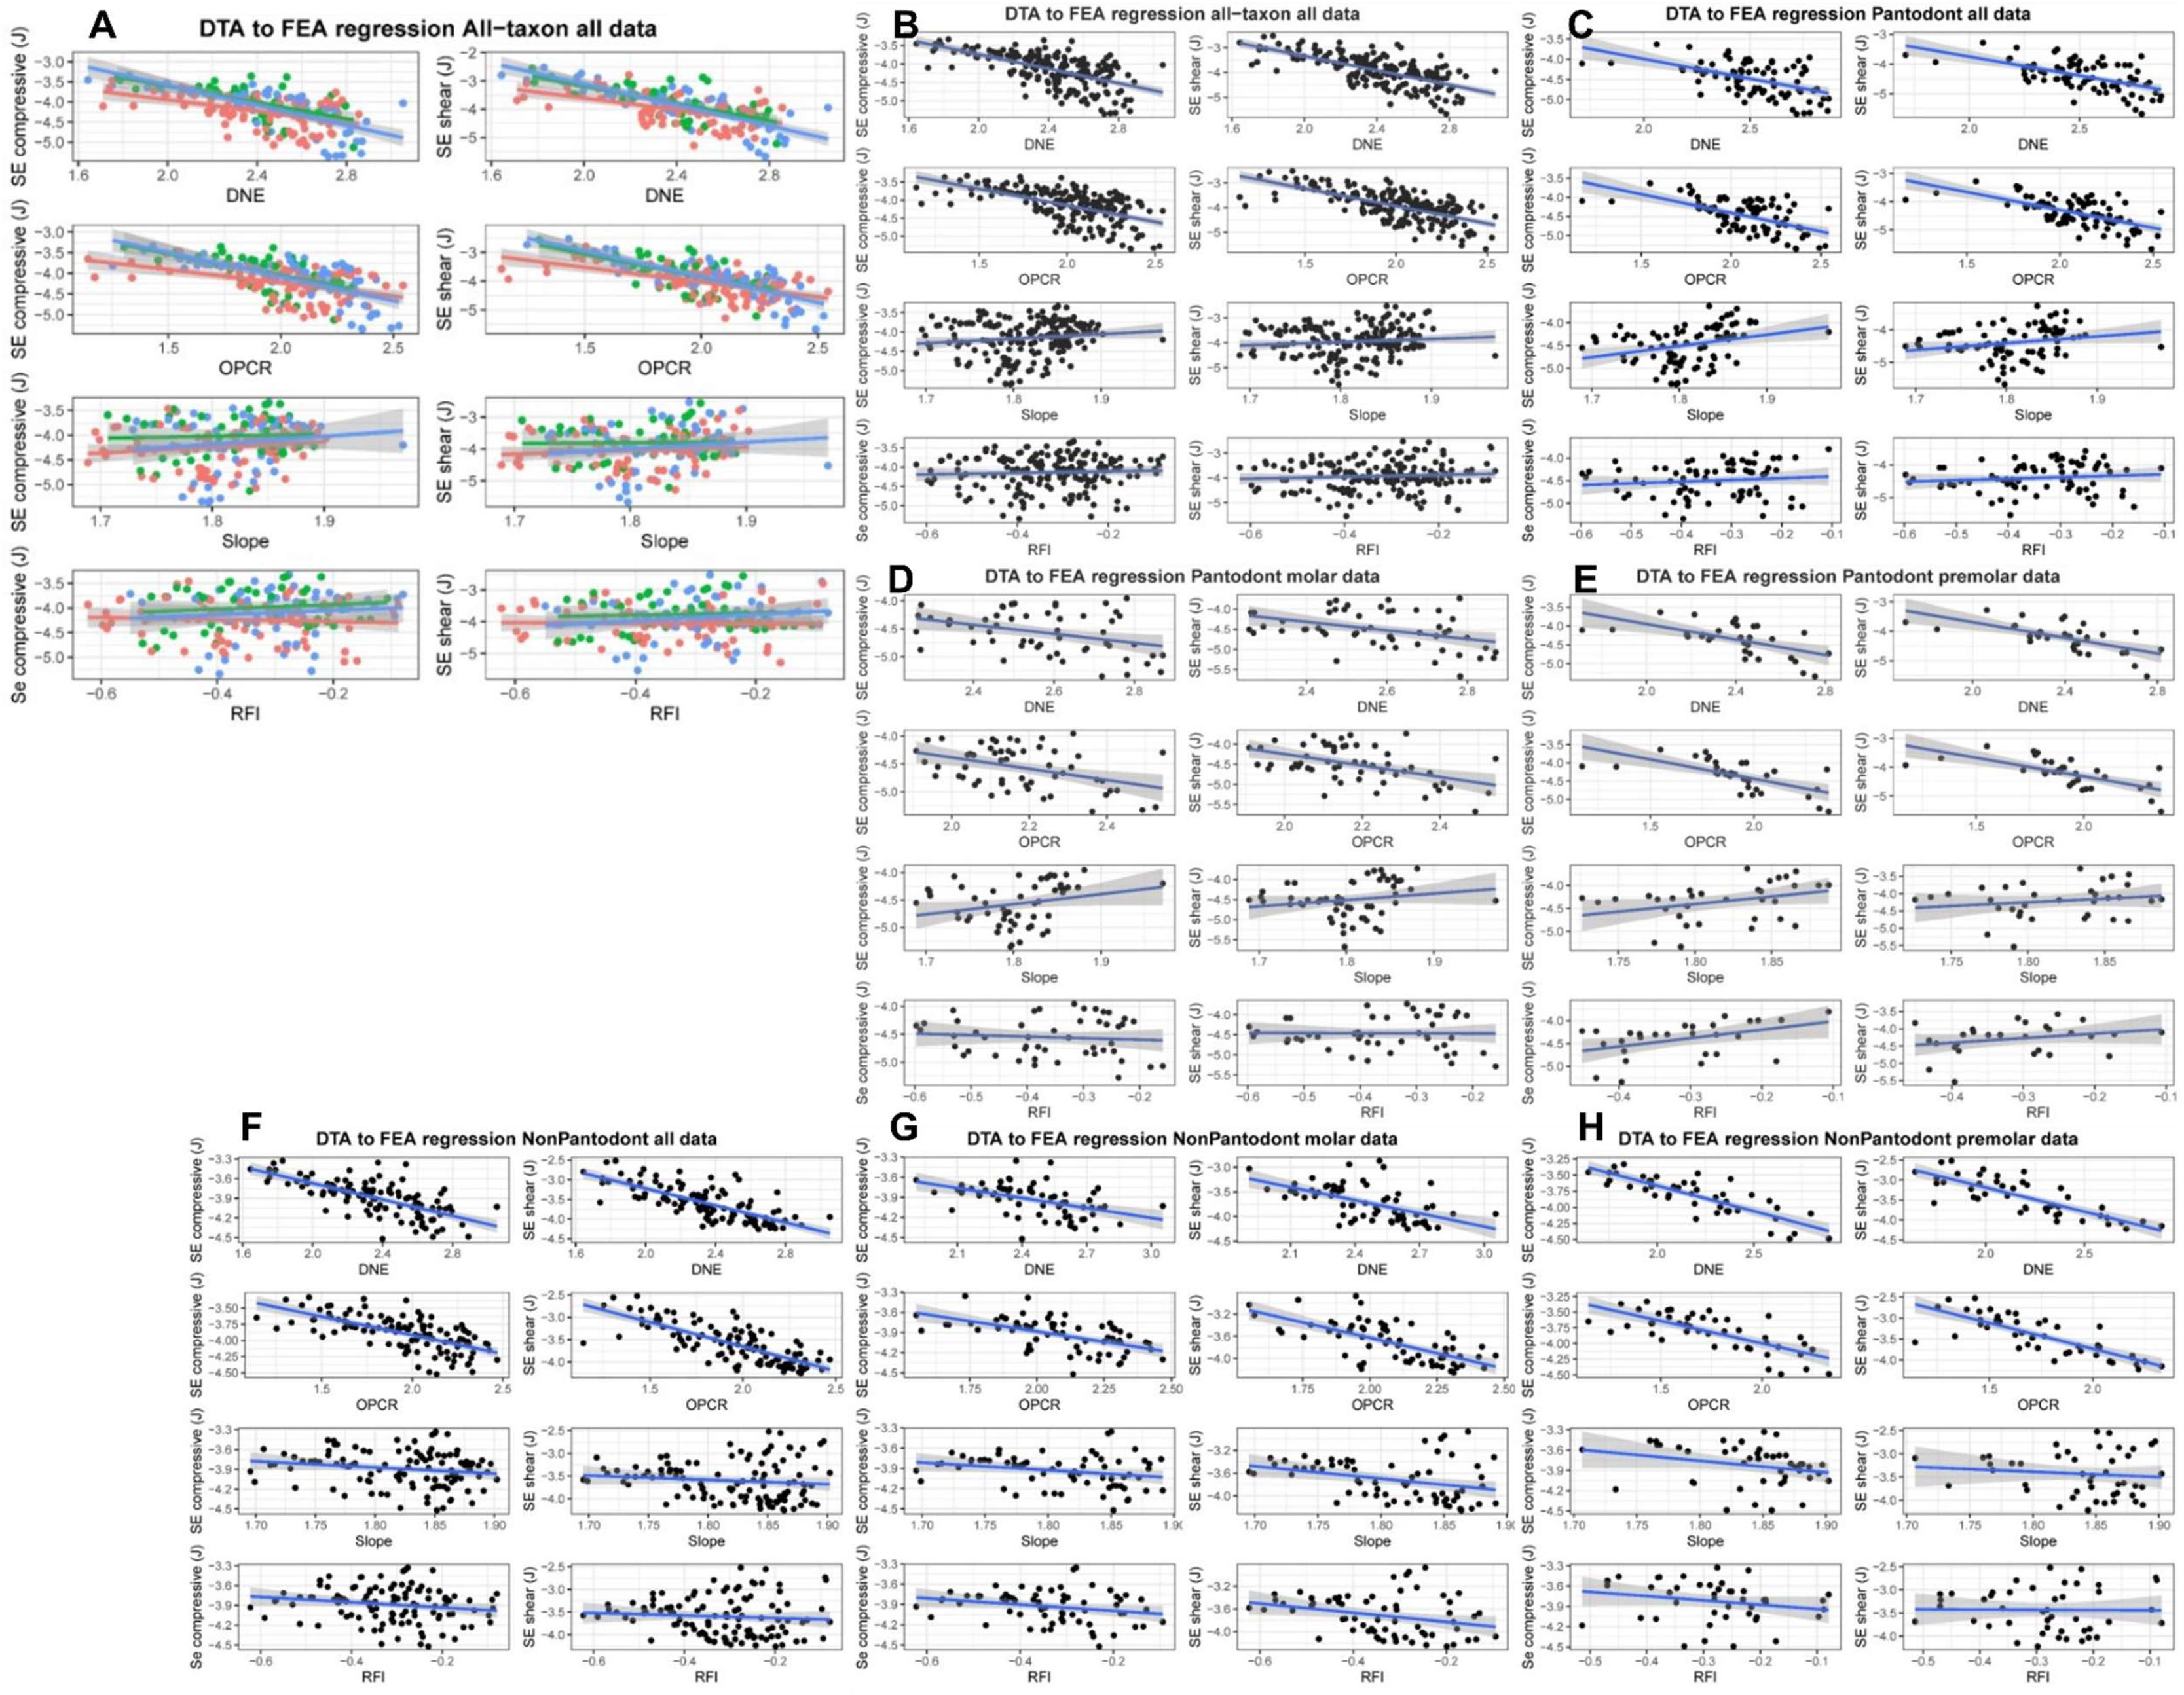
Linear regression analysis of dental topographic and bite performance datasets different data partitions, related to
Fig. 3
.
(
A
) All-taxon all-teeth data partition; data points are colored according to early (red), middle (green), and late (blue) Paleocene age of the specimens. (
B
) All-taxon all-teeth data partition without time bine groups. (
C
) Chinese endemic pantodont (CEP) all-teeth data partition. (
D
) CPE molar data partition. (
E
) CEP premolar data partition. (
F
) Non-pantodont all-teeth partition. (
G
) Non-pantodont molar partition. (
H
) Non-pantodont premolar partition. Performance variables estimated using finite element analysis includes tooth crown strain energy under compressive (left column within each panel) and shear bite (right column within each panel) simulations, respectively. Rows within panels represent different DTA metrics (from top to bottom: DNE, OPCR, Slope, RFI). Fitted regression lines are shown in blue; 95% confidence envelopes are shown in gray shades.
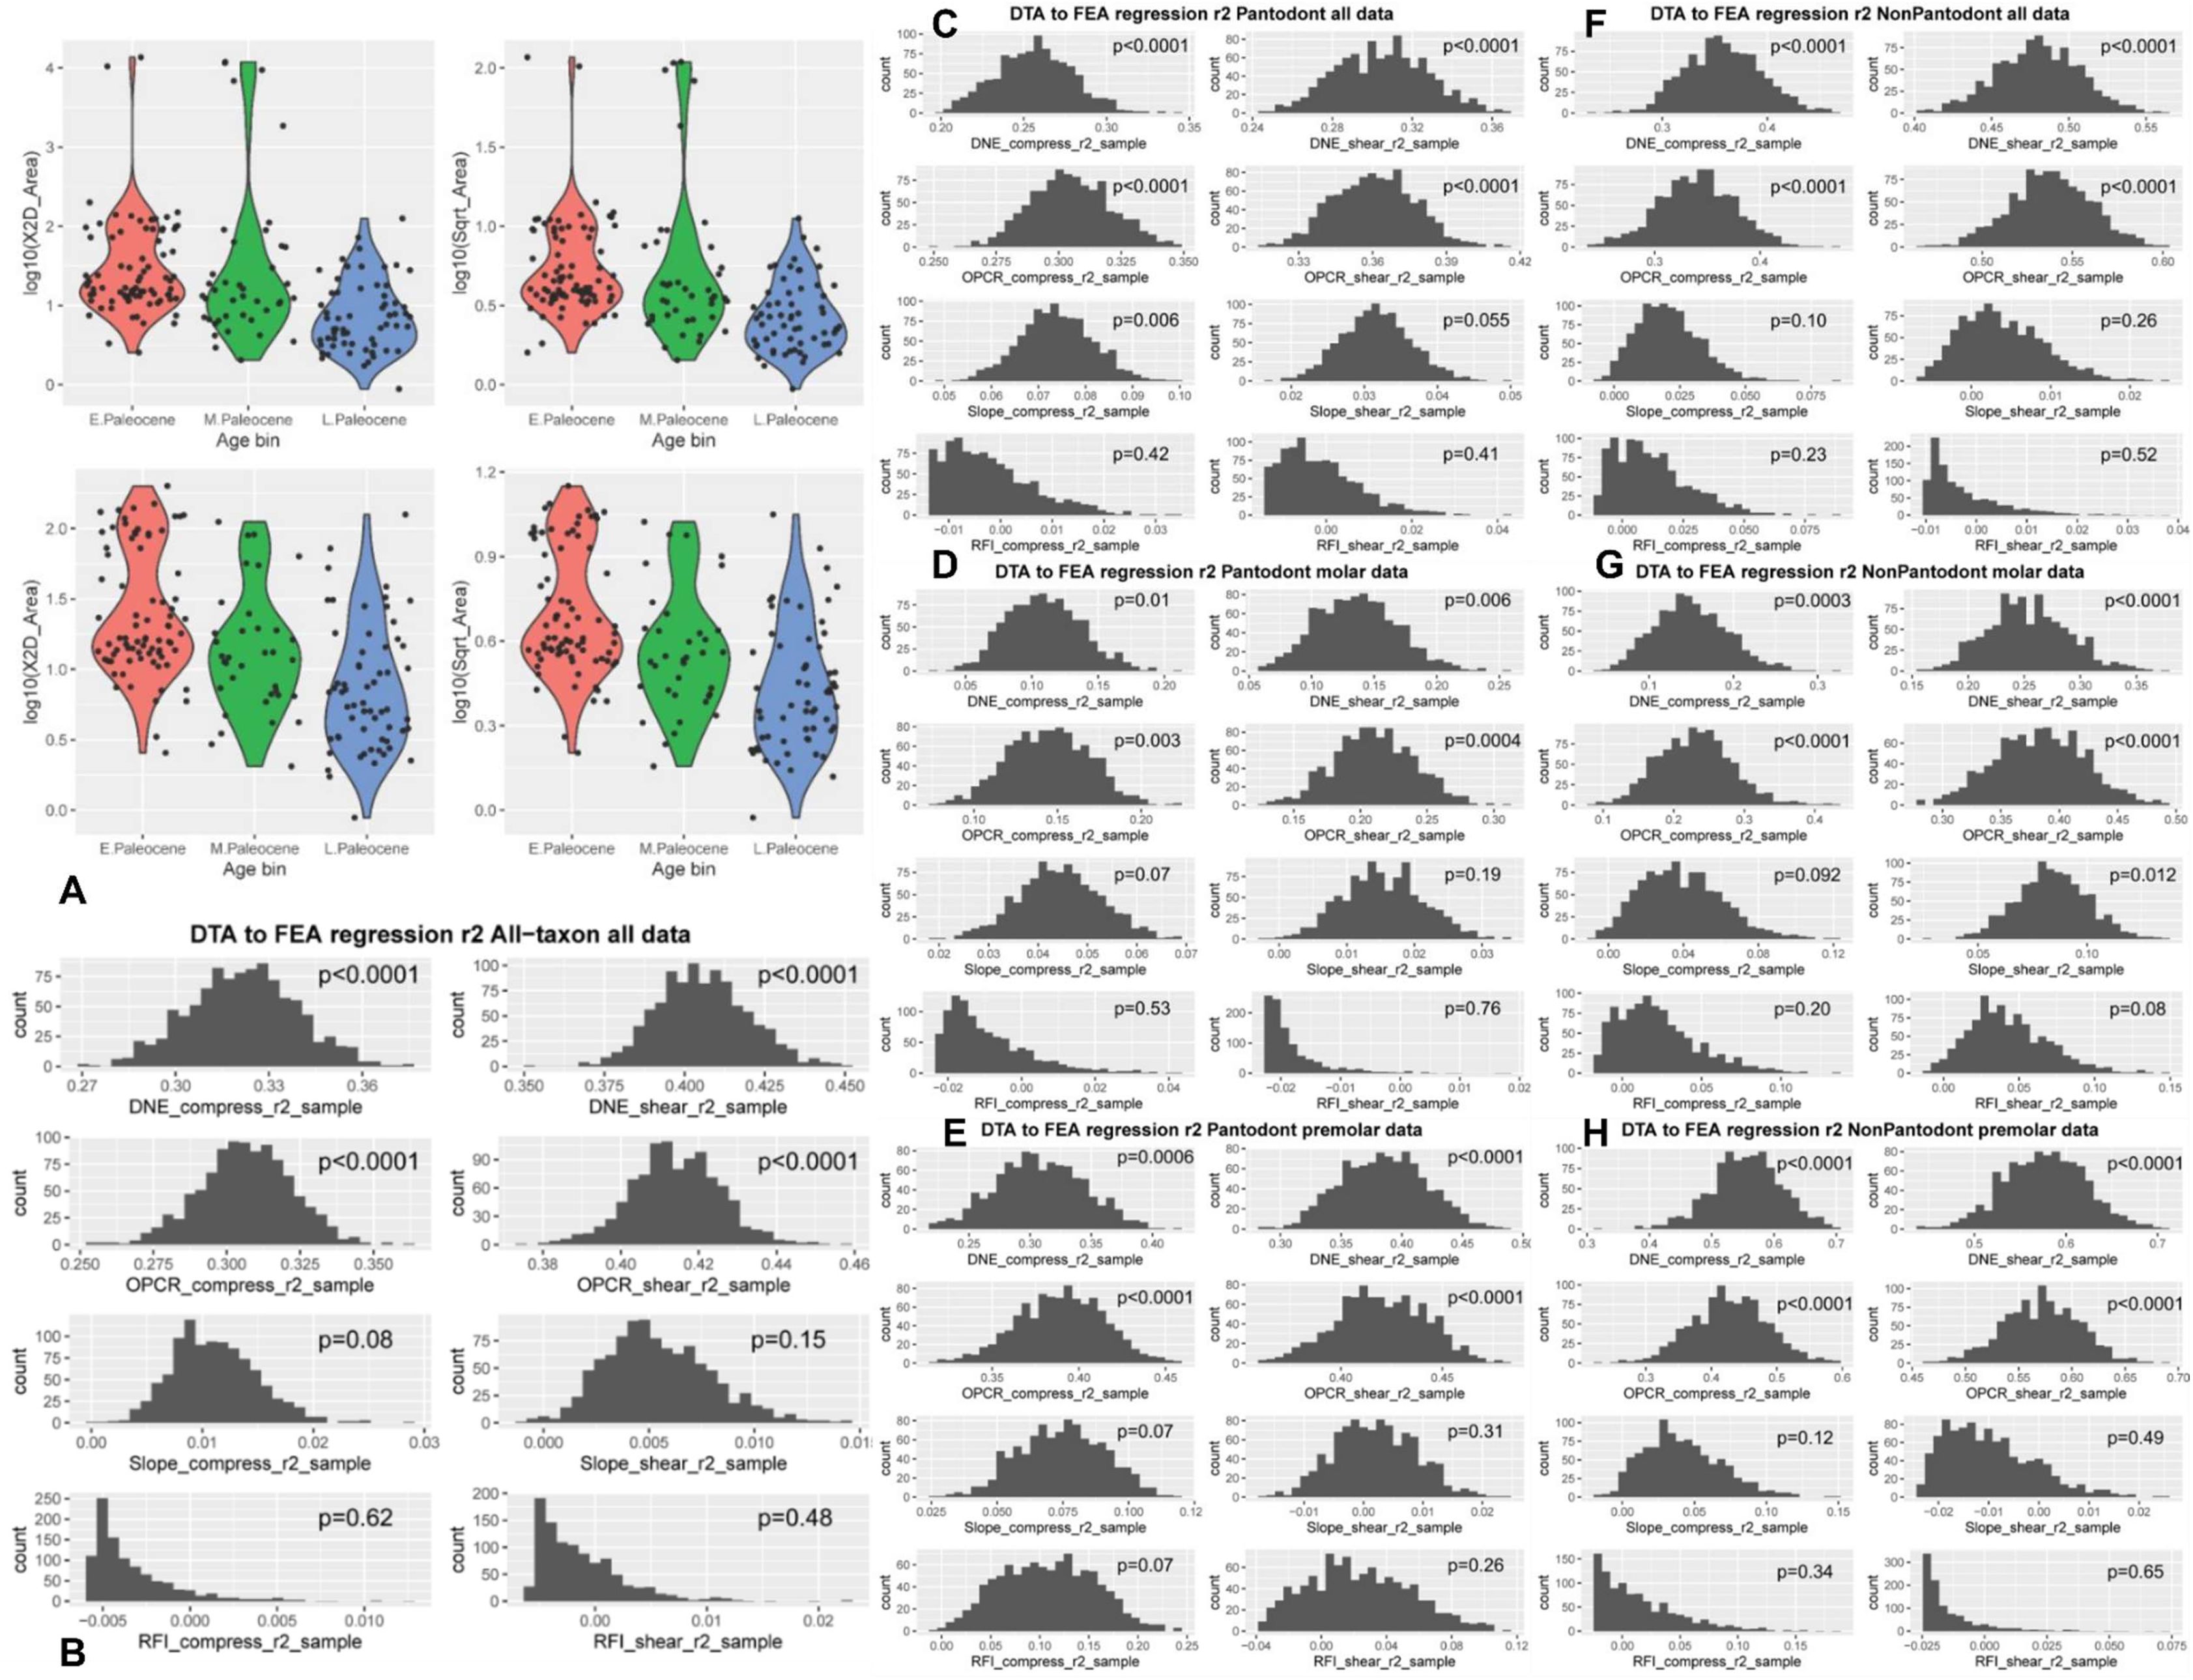
Tooth size boxplots and adjusted
r
2
distributions from DTA-FEA linear regression analyses, related to
Fig. 3
.
(
A
) Boxplots of tooth size by 2D area (left column within panel) or square root of 2D area (right column within panel). The top row within panel A includes sampling outliers (very large Chinese endemic pantodonts, CEPs), bottom row excludes outliers. The larger CEPs are removed in the bottom plots in order to more fully display the distribution of tooth sizes across the bimodal distribution of sizes in the main data cluster in each time bin, respectively.(B) Distribution of adjusted
r
2
values from linear regression analysis of dental topographic and dental performance datasets for all-taxon all-teeth data partition. (C) CEP all-teeth partition. (D) CEP molar partition. (E) CEP premolar partition. (F) Non-pantodont all-teeth partition. (G) Non-pantodont molar partition. (H) Non-pantodont premolar partition. Adjusted
r
2
values were generated from 1,000 bootstrap samples of DNE and FEA traits values for each specimen from uniform distributions that incorporate uncertainty in DNE and FEA values estimates.
P
-values calculated from
t
test of bootstrap sample
p
values against a hypothesis of
p
>= 0.05.
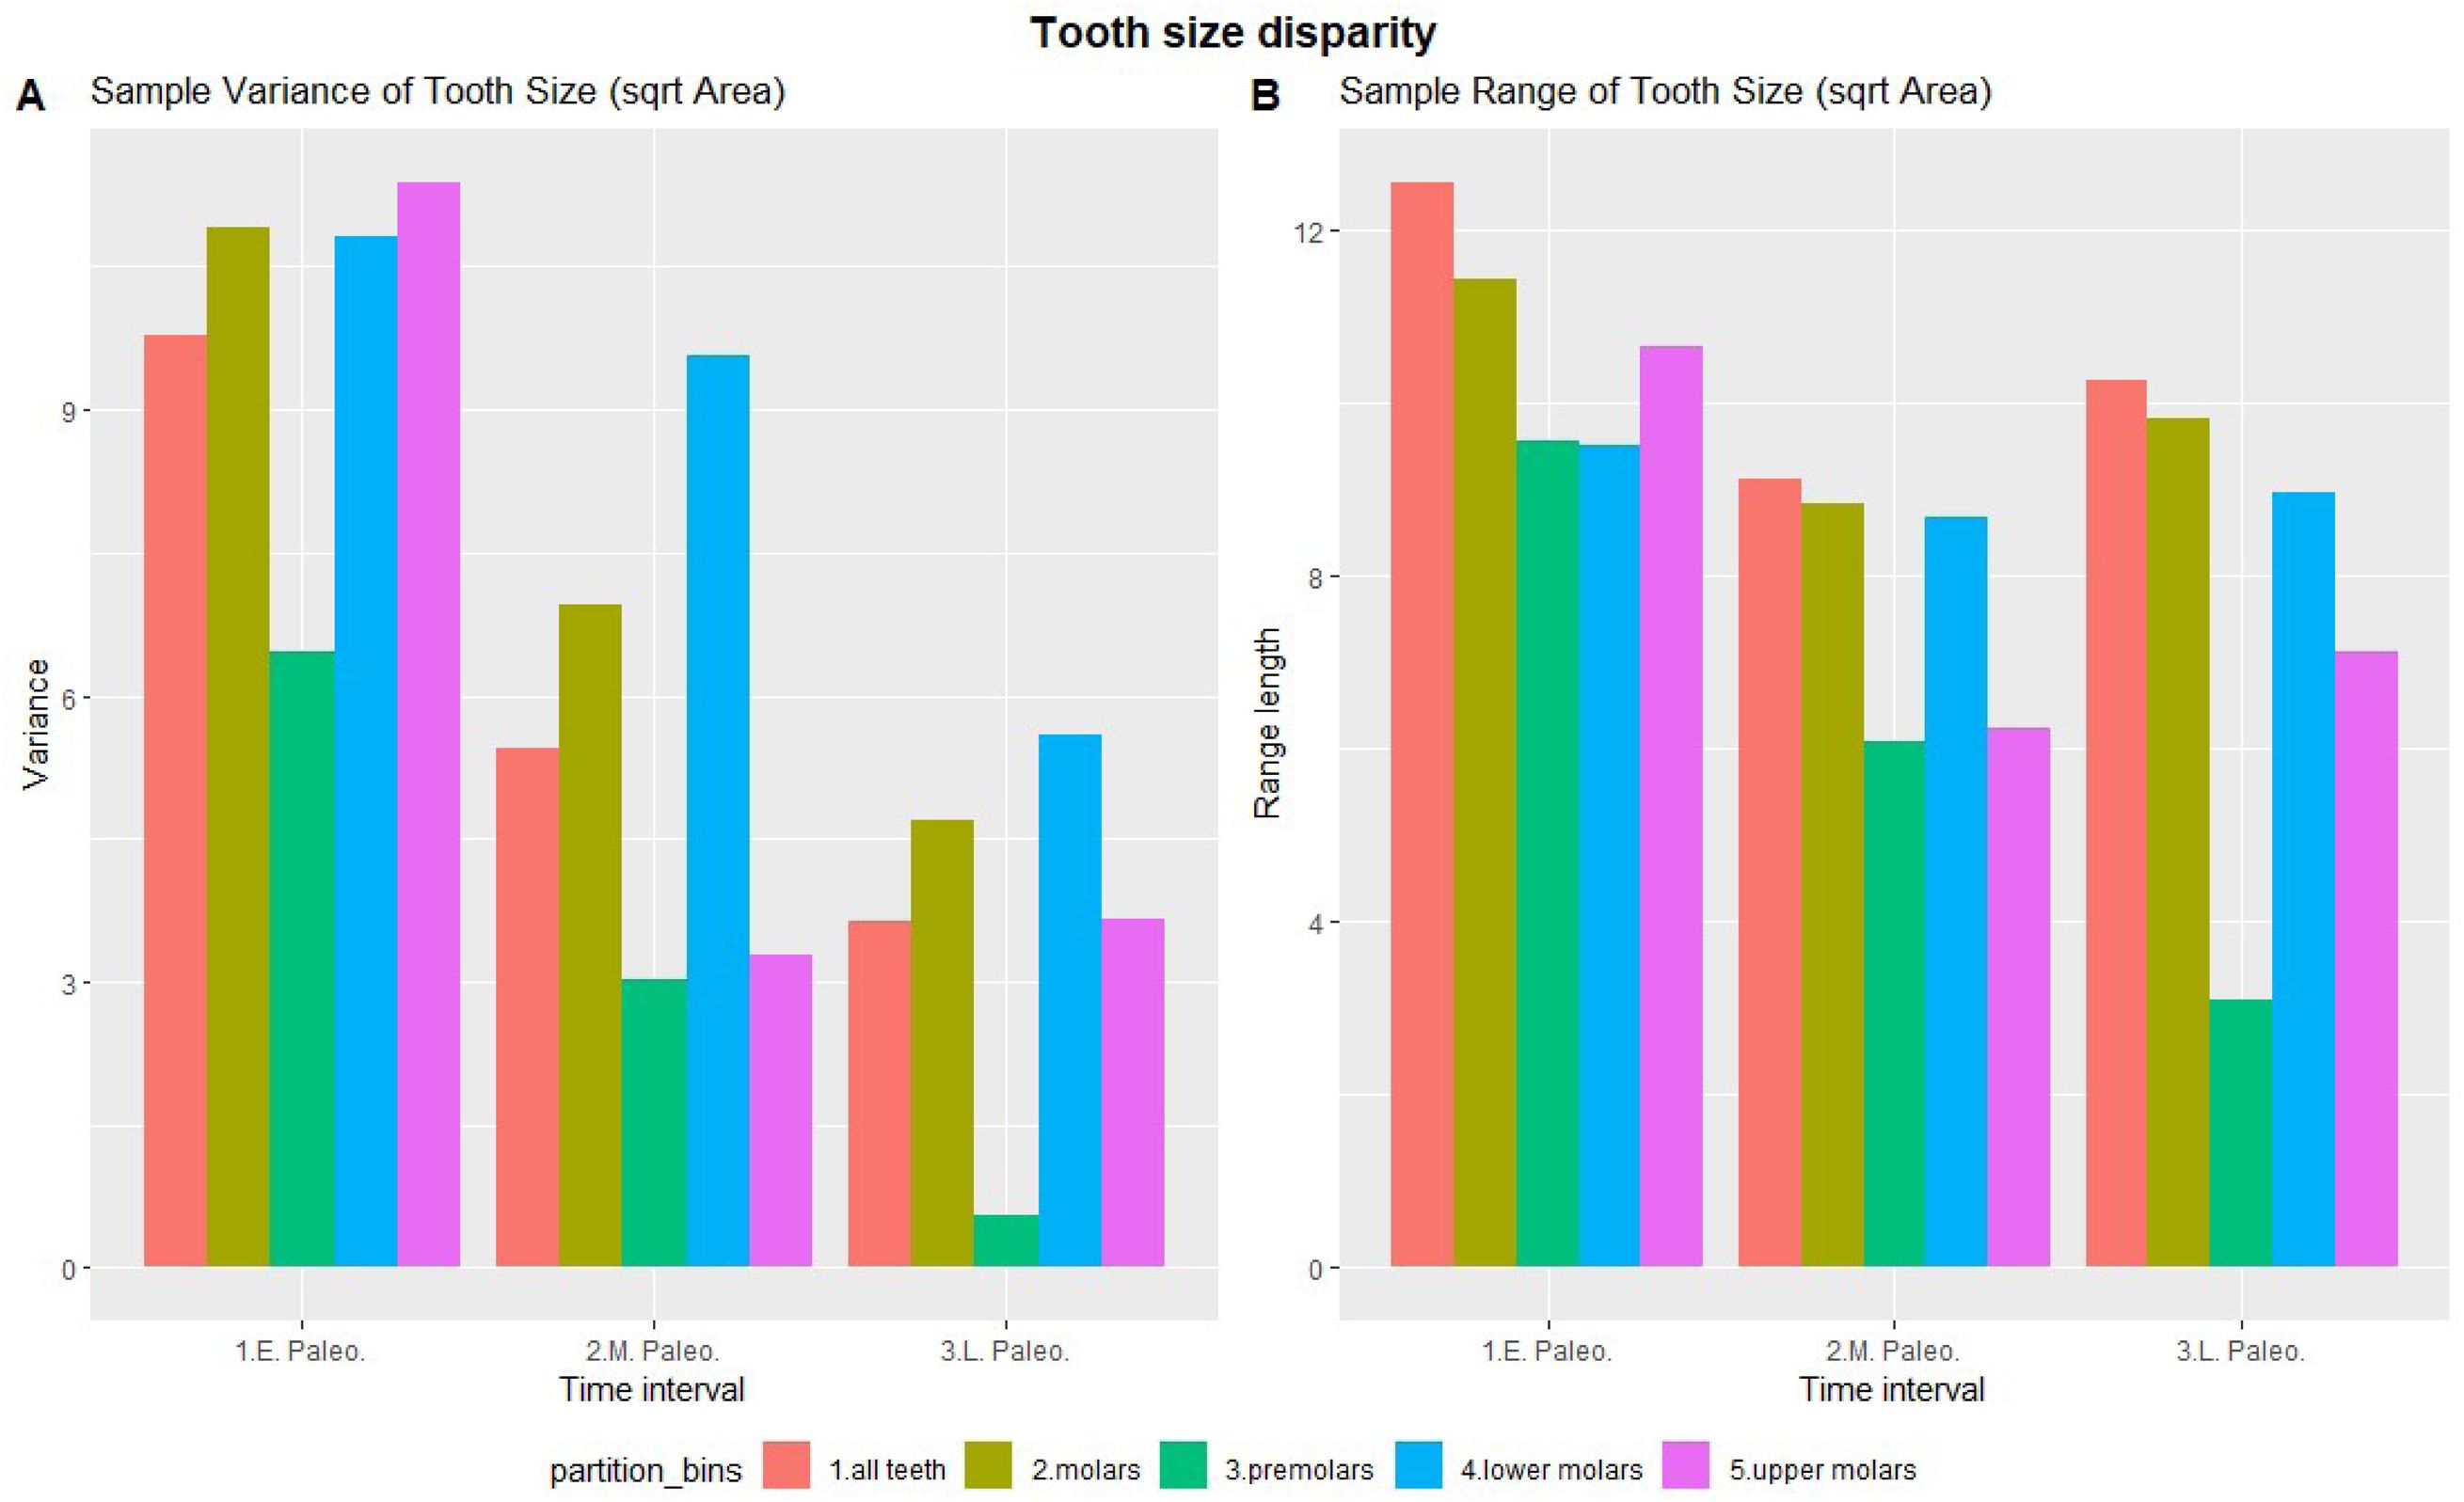
Tooth size disparity bar plots, related to
Fig. 1
.
(
A
) Variance of tooth size (sqrt of 2D tooth area) in different data partitions. (
B
) Range length of tooth size (sqrt of 2D tooth area) in different partitions.
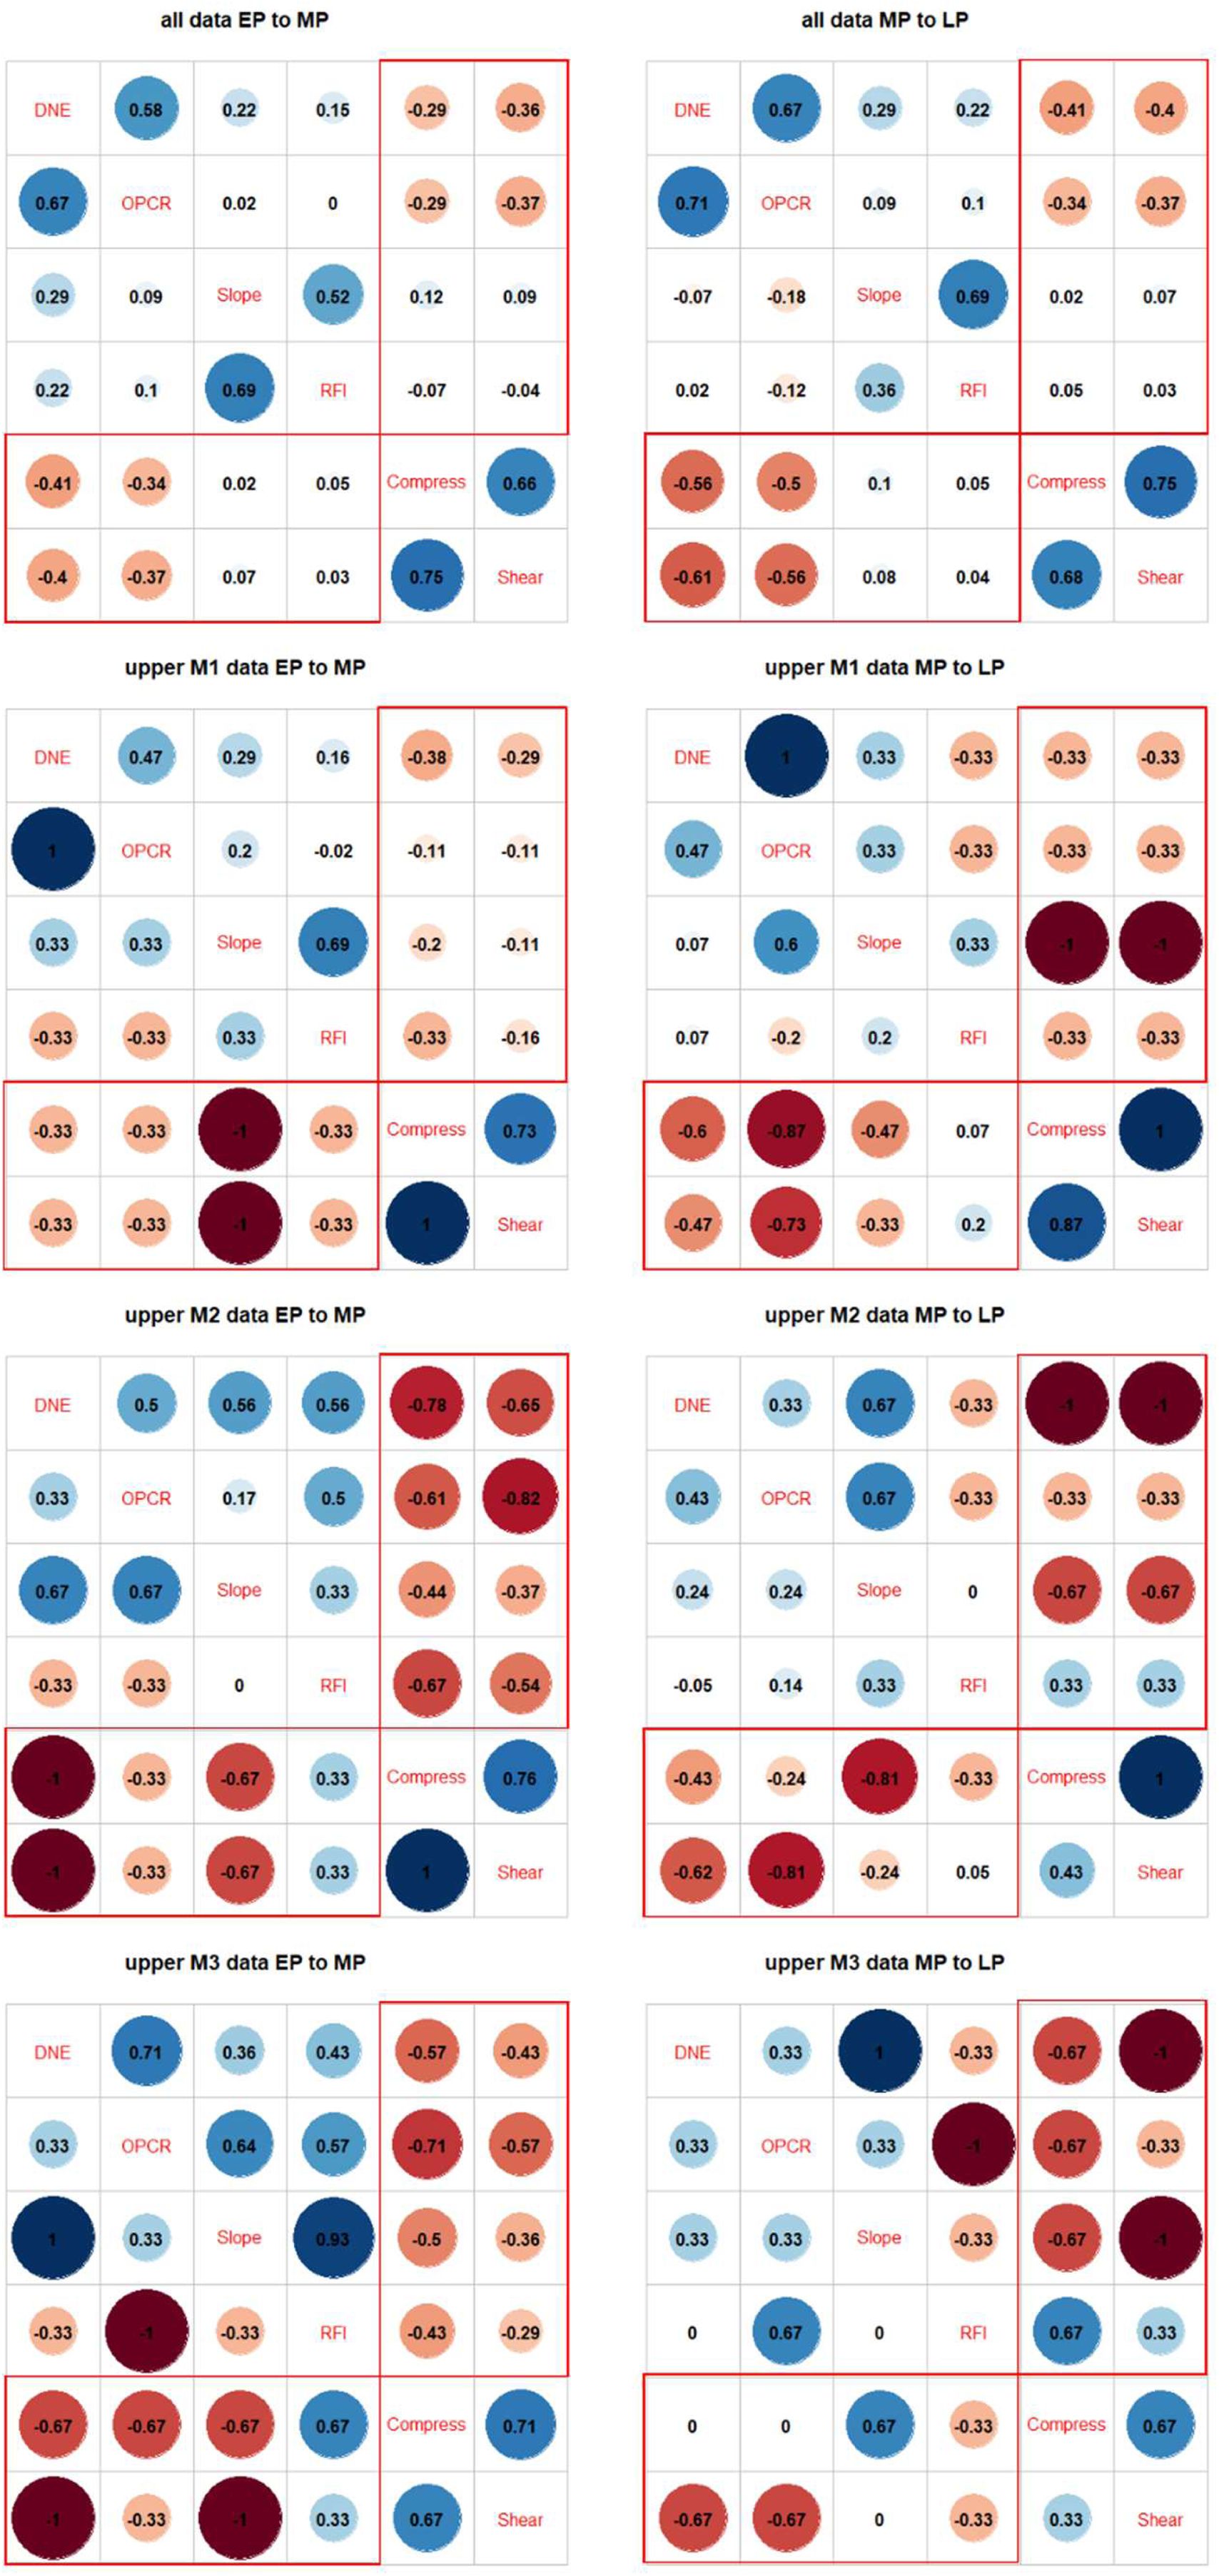
Correlation through time plots for upper molar DTA and FEA data, related to
Fig. 3
.
The upper diagonal in the left column shows early Paleocene (EP) correlations, the lower diagonal in the left column shows middle Paleocene (MP) correlations. The upper diagonal in the right column shows middle Paleocene correlations, and the lower diagonal in the right column shows late Paleocene (LP) correlations. Red boxes indicate correlations between DTA and FEA traits. Dark gray boxes indicate decoupling of correlation directions across time intervals. Upper M1 patterns general reflect the trend recovered from analysis of the overall dataset, but M2 and M3 results display inconsistent DTA-FEA correlations, possibly due to small sample sizes.
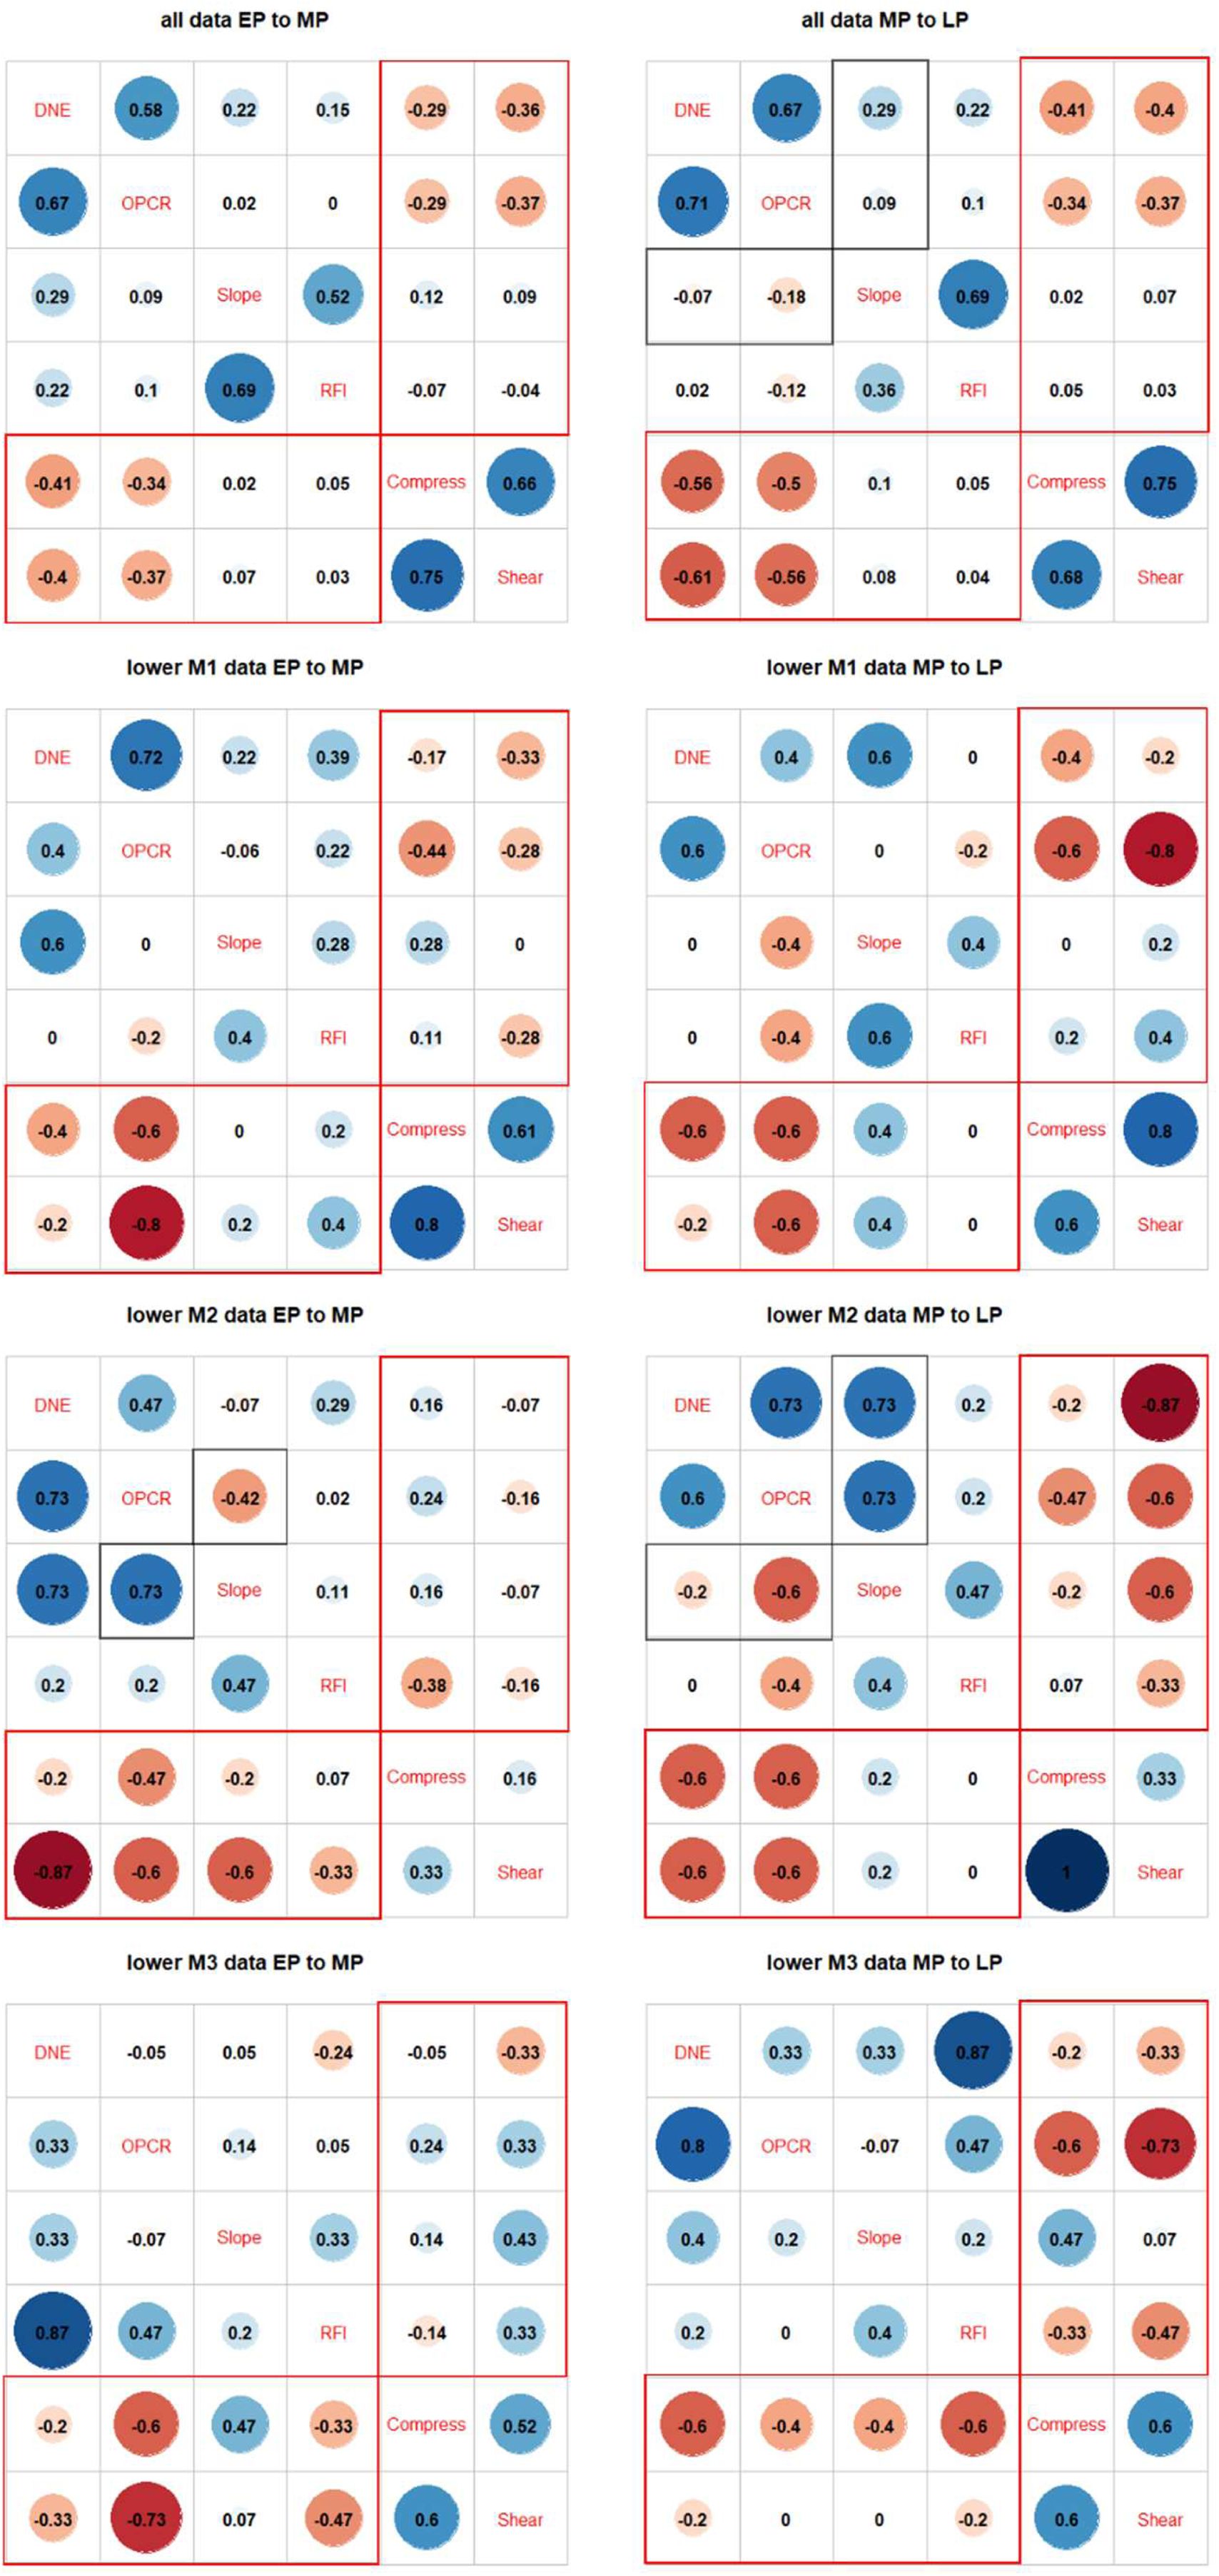
Correlation through time plots for lower molar DTA and FEA data, related to
Fig. 3
.
The upper diagonal in the left column shows early Paleocene (EP) correlations, the lower diagonal in the left column shows middle Paleocene (MP) correlations. The upper diagonal in the right column shows middle Paleocene correlations, and the lower diagonal in the right column shows late Paleocene (LP) correlations. Red boxes indicate correlations between DTA and FEA traits. Dark gray boxes indicate decoupling of correlation directions across time intervals. Lower molar patterns generally replicate those recovered in the overall analyses, but lower M1 and M2 signals appear to be stronger than those for lower M3.
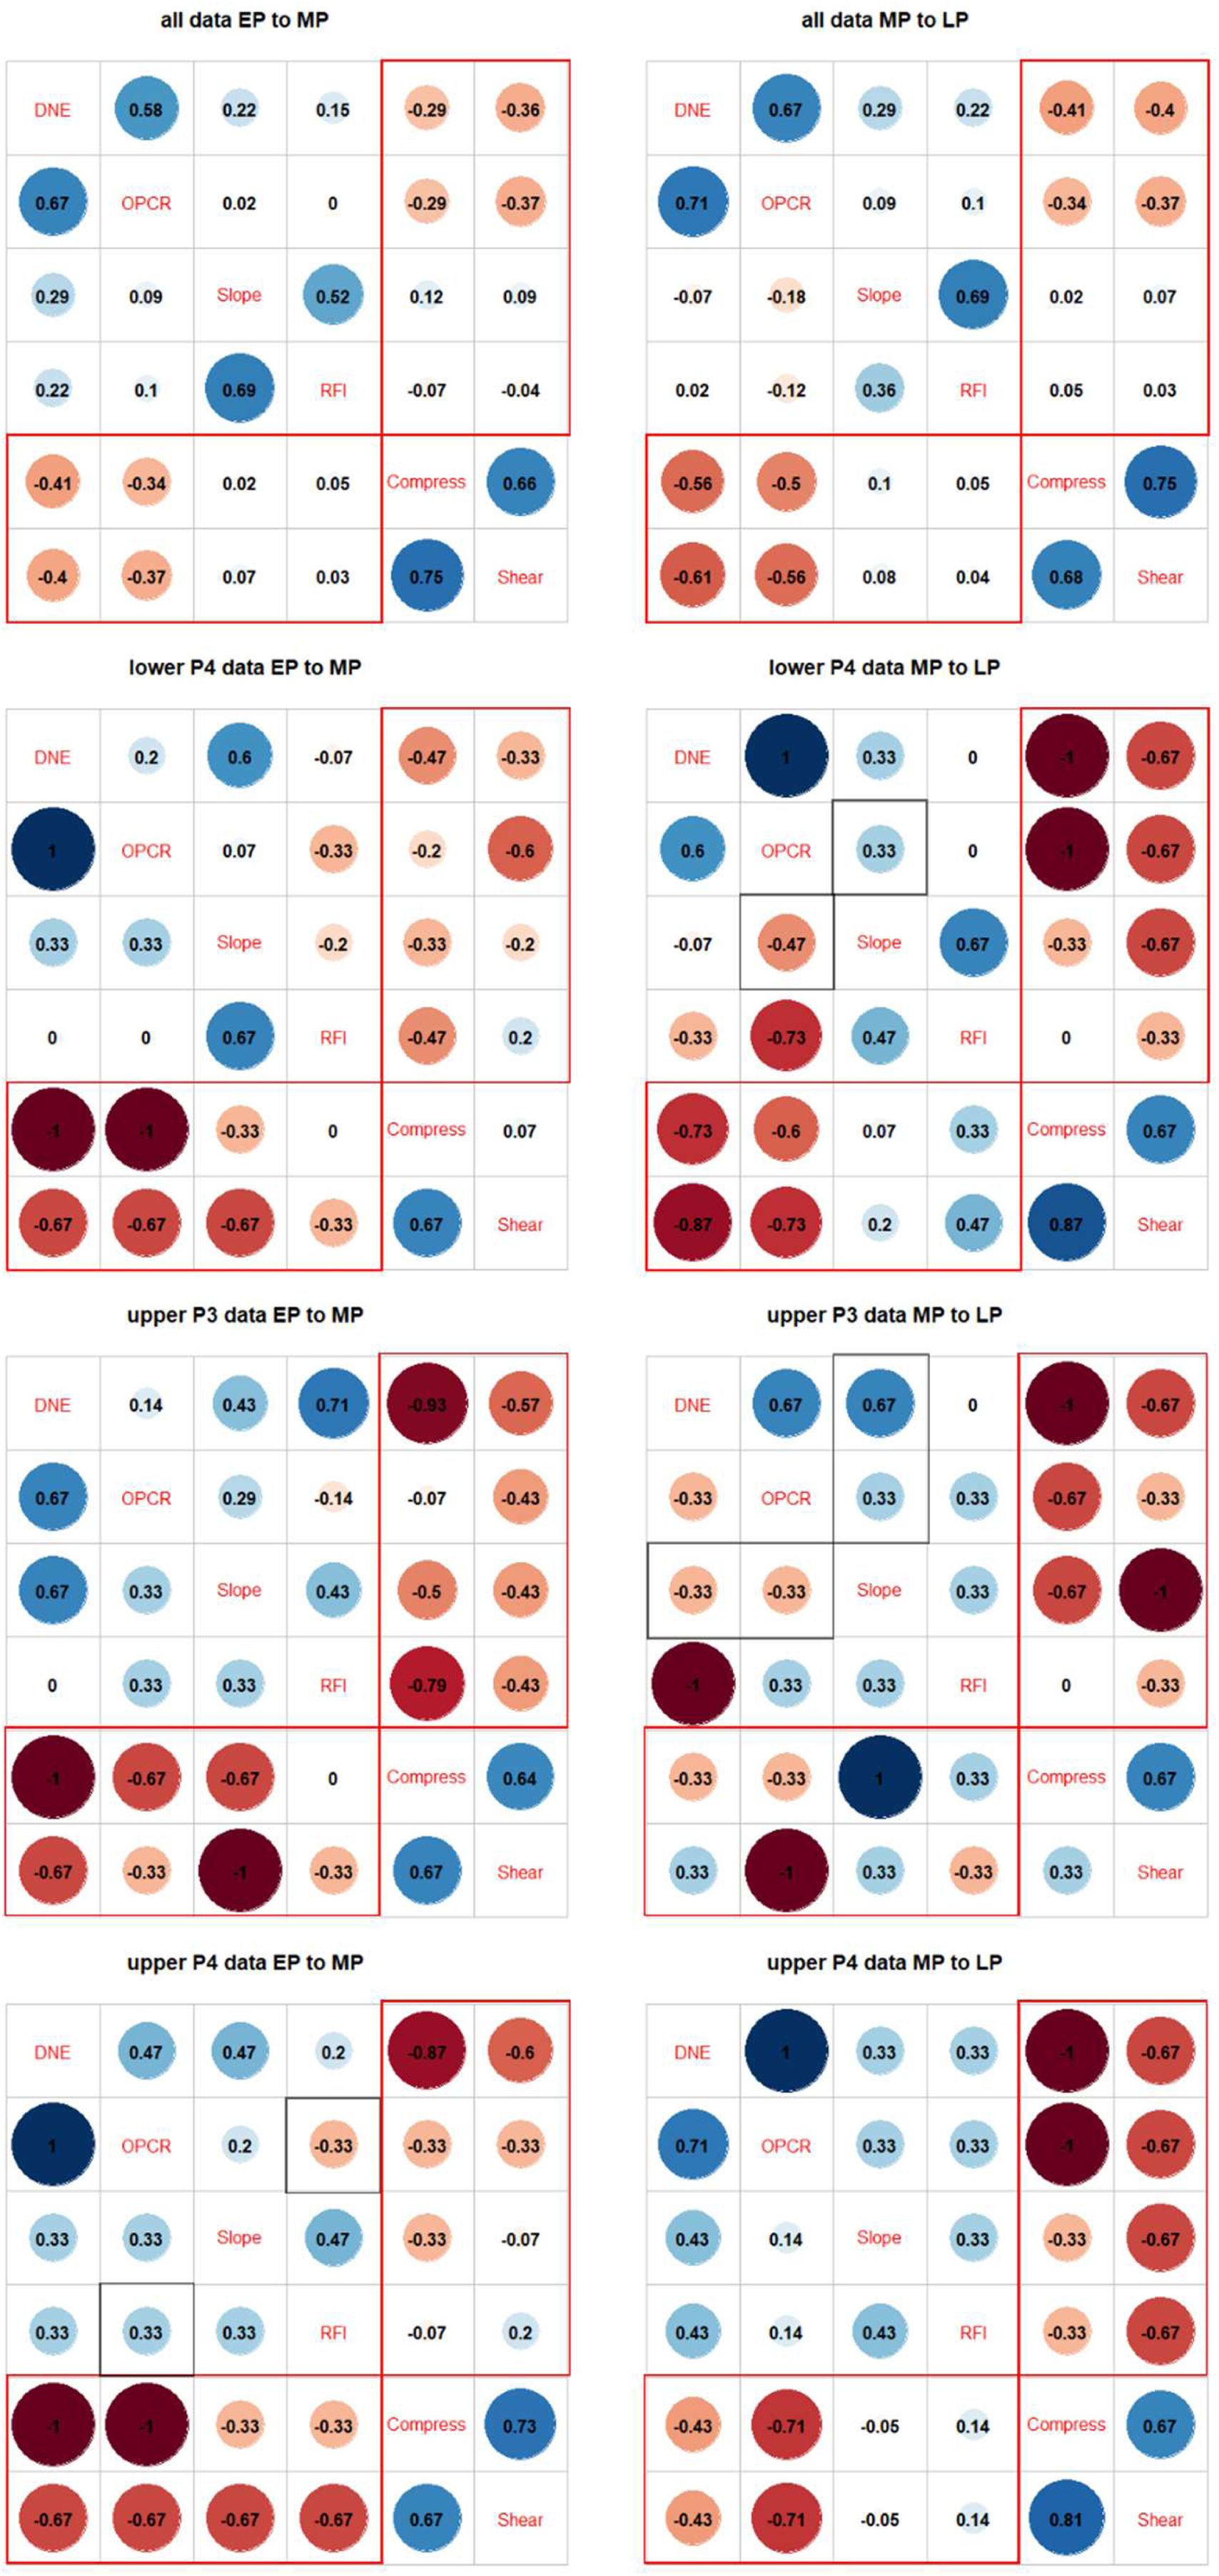
Correlation through time plots for premolar DTA and FEA data, related to
Fig. 3
.
The upper diagonal in the left column shows early Paleocene (EP) correlations, the lower diagonal in the left column shows middle Paleocene (MP) correlations. The upper diagonal in the right column shows middle Paleocene correlations, and the lower diagonal in the right column shows late Paleocene (LP) correlations. Red boxes indicate correlations between DTA and FEA traits. Dark gray boxes indicate decoupling of correlation directions across time intervals. Low sample sizes make premolar correlations unstable, with general pattern showing EP-MP strengthening then MP-LP stasis or weakening
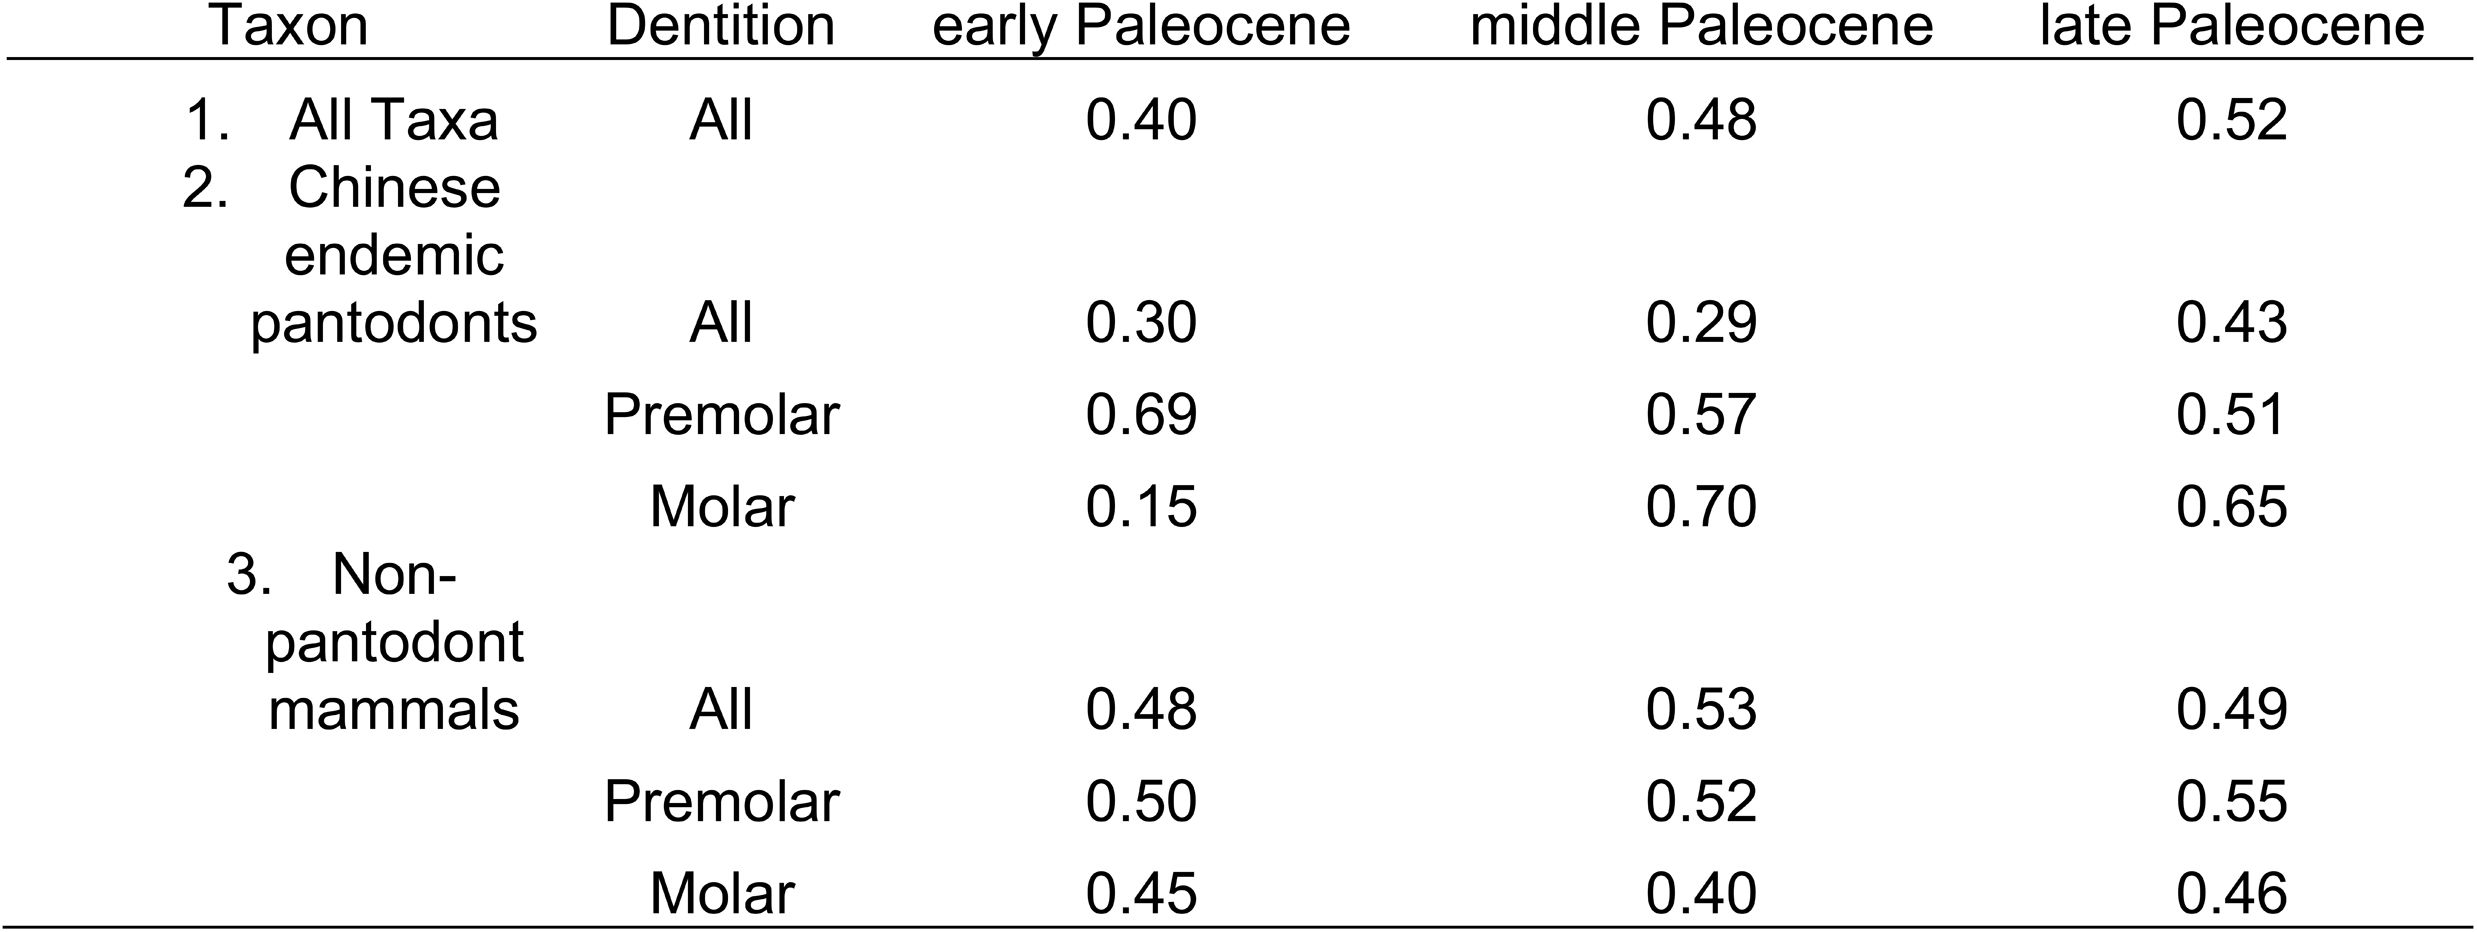
Two-block partial least squares (PLS)
r
coefficients from bootstrapped analyses, related to
Fig. 3
.
1,000 bootstrap samples of DTA and FEA values were taken from uniform distributions of trait uncertainty ranges, and two-block partial east squared analysis conducted on each sample for early-middle Paleocene and middle-late Paleocene data partition pairings, respectively. All
r
values are statistically significantly different (
p
< 0.05) between adjacent time intervals, based on a one-sample t test of the distribution of 1,000 p values from the bootstrap two-block PLS samples against
p
< 0.05.

Relative percentages of fossil pollen found in the Nanxiong Basin, Related to
Fig. 2
and based on
96
.
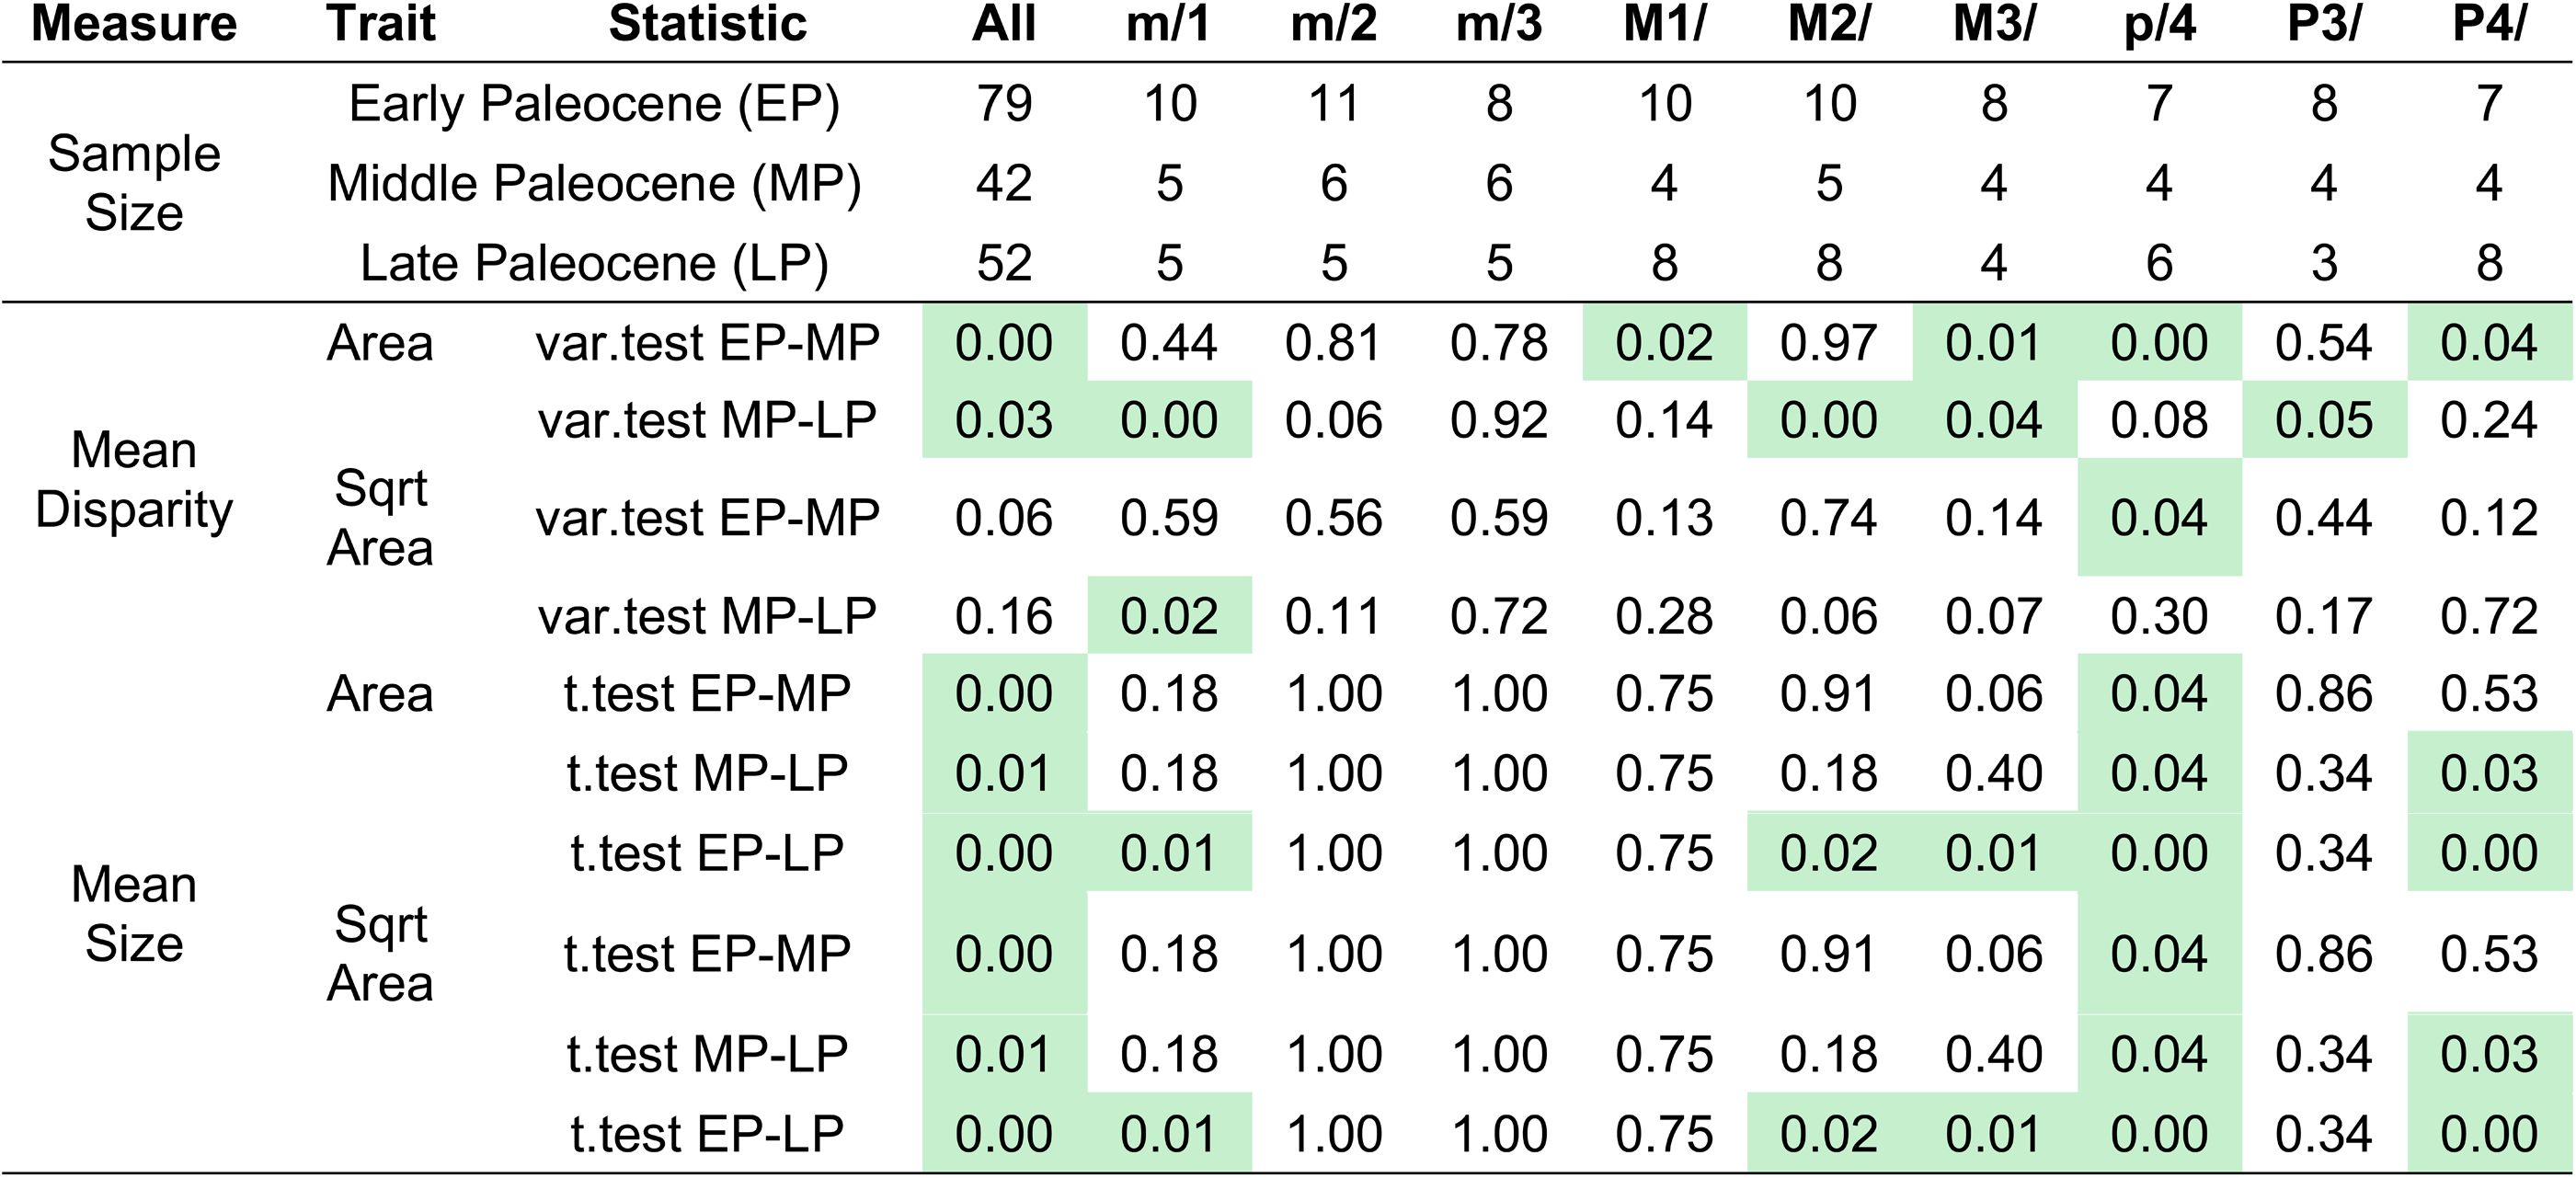
Sample size, disparity, and mean tooth size by tooth position. Related to
Fig. 1
.
Mean disparity difference is measured by pair-wise variance tests (var.test); mean tooth size difference is measured by pairwise
t
tests (t.test).
p
values <=0.05 are shaded. Overall disparity trends are also observed in premolar and upper molar data partitions, whereas overall tooth size trends are observed mainly in the lower premolar 4 data partition. Decrease in mean tooth size is most consistently observe across multiple tooth partitions for the early Paleocene to late Paleocene comparison.
Data availability
All data and code are either included as supplemental information or posted at FigShare (10.6084/m9.figshare.28611854).
Acknowledgements
We thank I. Ruiz for assisting with generating 3D tooth models from CT data; X. Tseng for assisting with data collection; P. Holroyd for assisting with locating specimen casts in the collections of the University of California Museum of Paleontology; J. Liu for helpful discussion and comments on earlier versions of the study. Z. Luo provided earnest and constructive feedback on an earlier version of the study. Editor S. Rasmann and two anonymous reviewers provided highly constructive feedback on the study.
Additional information
Funding
This study was funded in part by grant 213109 from the Nanjing Institute of Geology and Paleontology, Chinese Academy of Sciences (to QL and ZJT) and National Key Research and Development Project of China (2024YFF0807603; to QL).
Author contributions
Conceptualization: All authors.
Methodology: ZJT.
Formal analyses: ZJT.
Investigation: All authors.
Results acquisition: ZJT.
Raw data acquisition (surface and CT scan data): ZJT, QL.
Writing, original draft: ZJT.
Writing, review, and editing: All authors.
Visualization: ZJT, QL.
Funding
CAS | Nanjing Institute of Geology and Paleontology, Chinese Academy of Sciences (NIGPAS, CAS) (213109)
Qian Li
Z Jack Tseng
MOST | National Key Research and Development Program of China (NKPs) (2024YFF0807603)
Qian Li
Additional files
References
1.
The placental mammal ancestor and the post–K-Pg radiation of placentals
Science
339
:662–667
PubMed
Google Scholar
2.
Genomic evidence reveals a radiation of placental mammals uninterrupted by the KPg boundary
Proc. Natl. Acad. Sci
114
:E7282–E7290
PubMed
Google Scholar
3.
A genomic timescale for placental mammal evolution
Science
380
:eabl8189
PubMed
Google Scholar
4.
Early Cenozoic increases in mammal diversity cannot be explained solely by expansion into larger body sizes
Palaeontology
66
:e12653
Google Scholar
5.
Untangling the Multiple Ecological Radiations of Early Mammals
Trends Ecol. Evol
34
:936–949
PubMed
Google Scholar
6.
Molecules and fossils tell distinct yet complementary stories of mammal diversification
Curr. Biol
31
:4195–4206
PubMed
Google Scholar
7.
Resolving the relationships of Paleocene placental mammals
Biol. Rev
92
:521–550
PubMed
Google Scholar
8.
The global vegetation pattern across the Cretaceous–Paleogene mass extinction interval: a template for other extinction events
Glob Planet Change
122
:29–49
Google Scholar
9.
Island life in the Cretaceous-faunal composition, biogeography, evolution, and extinction of land-living vertebrates on the Late Cretaceous European archipelago
Zookeys
:1–161
PubMed
Google Scholar
10.
The oldest Cenozoic mammal fauna of Europe: implication of the Hainin reference fauna for mammalian evolution and dispersals during the Paleocene
J. Syst. Palaeontol
15
:741–785
Google Scholar
11.
Major events of Paleogene mammal radiation in China
Geol J
42
:415–430
Google Scholar
12.
Plant and mammal diversity in the Paleocene to early Eocene of the Bighorn Basin
Palaeogeogr Palaeoclimatol Palaeoecol
115
:117–155
https://doi.org/10.1016/0031-0182(94)00109-l
Google Scholar
13.
The fossil record of North American mammals: evidence for a Paleocene evolutionary radiation
Syst Biol
48
:107–118
PubMed
Google Scholar
14.
Severe extinction and rapid recovery of mammals across the Cretaceous–Palaeogene boundary, and the effects of rarity on patterns of extinction and recovery
J. Evol. Biol
29
:1495–1512
PubMed
Google Scholar
15.
Exceptional continental record of biotic recovery after the Cretaceous–Paleogene mass extinction
Science
366
:977–983
PubMed
Google Scholar
16.
Mammalian extinction, survival, and recovery dynamics across the Cretaceous-Paleogene boundary in northeastern Montana, USA
In:
Wilson G. P.
Clemens W. A.
Horner J. R.
Hartman J. H.
, editors.
Through the End of the Cretaceous in the Type Locality of the Hell Creek Formation in Montana and Adjacent Areas
Geological Society of America
https://doi.org/10.1130/2014.2503(15)
Google Scholar
17.
Therian mammals experience an ecomorphological radiation during the Late Cretaceous and selective extinction at the K–Pg boundary
Proc. R. Soc. B Biol. Sci
283
:20160256
Google Scholar
18.
Mammalian faunal succession through the Paleocene-Eocene Thermal MAximum (PETM) in western North America
Vertebr Palasiat
48
:308–327
Google Scholar
19.
Mammalian dispersal at the Paleocene/Eocene boundary
Science
295
:2062–2065
PubMed
Google Scholar
20.
Mammals across the K/Pg boundary in northeastern Montana, U.S.A.: dental morphology and body-size patterns reveal extinction selectivity and immigrant-fueled ecospace filling
Paleobiology
39
:429–469
Google Scholar
21.
Brawn before brains in placental mammals after the end-Cretaceous extinction
Science
376
:80–85
PubMed
Google Scholar
22.
Patterns of mammalian jaw ecomorphological disparity during the Mesozoic/Cenozoic transition
Proc. R. Soc. B Biol. Sci
286
:20190347
PubMed
Google Scholar
23.
Paleocene mammalian fauna from the Nanxiong Basin
Guangdong Province Paleontol Sin New Ser C
20
:1–100
Google Scholar
24.
An integrated stratigraphic record from the Paleocene of the Chijiang Basin, Jiangxi Province (China): Implications for mammalian turnover and Asian block rotations
Earth Planet Sci Lett
269
:554–564
Google Scholar
25.
New paleomagnetic and stable-isotope results from the Nanxiong Basin, China: implications for the K/T boundary and the timing of Paleocene mammalian turnover
J. Geol.
118
:131–143
Google Scholar
26.
Asian early Paleogene chronology and mammalian faunal turnover events
Vertebr Palasiat
49
:1–28
Google Scholar
27.
A synopsis of Paleocene stratigraphy and vertebrate paleontology in the Qianshan Basin, Anhui
China Vertebr Palasiat
54
:89–120
Google Scholar
28.
Dental enamel as a dietary indicator in mammals
BioEssays
30
:374–385
PubMed
Google Scholar
29.
Imbalanced speciation pulses sustain the radiation of mammals
Science
384
:1007–1012
PubMed
Google Scholar
30.
High terrestrial temperature in the low-latitude Nanxiong Basin during the Cretaceous-Paleogene boundary interval
Palaeogeogr Palaeoclimatol Palaeoecol
617
:111489
Google Scholar
31.
The paleoclimatic significance indicated by the Early Paleogene gray-black mudstone layers lies in Nanxiong Basin
Quat. Sci
44
:1250–1261
Google Scholar
32.
Paleoclimate indication of terrigenous clastic rock’s component during the Late Cretaceous–Early Paleocene in the Nanxiong Basin
Acta Sedimentol Sin
33
:116–123
Google Scholar
33.
Palaeoclimate evolution across the Cretaceous–Palaeogene boundary in the Nanxiong Basin (SE China) recorded by red strata and its correlation with marine records
Clim Past
14
:287–302
Google Scholar
34.
Early Paleocene vegetation and climate in Jiayin, NE China
Clim Change
99
:547–566
Google Scholar
35.
A major environmental shift by the middle Eocene in southern China: Evidence from palynological records
Rev. Palaeobot. Palynol
278
:104226
Google Scholar
36.
Spatiotemporal evolution of Paleogene palynoflora in China and its implication for development of the extensional basins in East China
Rev. Palaeobot. Palynol
184
:24–35
Google Scholar
37.
Uplift, climate and biotic changes at the Eocene–Oligocene transition in south-eastern Tibet
Natl Sci Rev
6
:495–504
PubMed
Google Scholar
38.
Phenotypic response of foraminifera to episodes of global environmental change
Biot response to Glob Environ Chang last
145
:51–78
Google Scholar
39.
Environmental changes during the Cretaceous-Paleogene mass extinction and Paleocene-Eocene thermal maximum: implications for the Anthropocene
Gondwana Res
56
:69–89
Google Scholar
40.
Late Paleocene CO2 drawdown, climatic cooling and terrestrial denudation in the southwest Pacific
Clim Past
18
:1295–1320
Google Scholar
41.
Mesozoic mammals of China: implications for phylogeny and early evolution of mammals
Natl Sci Rev
1
:521–542
Google Scholar
42.
Direct stratigraphic dating of India-Asia collision onset at the Selandian (middle Paleocene, 59±1 Ma)
Geology
43
:859–862
Google Scholar
43.
Terrestrial records of two hyperthermal events in the Cretaceous-Paleogene boundary suggest different control mechanisms
Commun. Earth Environ
5
:1–7
Google Scholar
44.
Many-to-One Mapping of Form to Function: A General Principle in Organismal Design?
Integr Comp Biol
45
:256–262
PubMed
Google Scholar
45.
Combining geometric morphometrics and finite element analysis with evolutionary modeling: towards a synthesis
J. Vertebr. Paleontol
36
:e1111225
Google Scholar
46.
Functional optimality underpins the repeated evolution of the extreme saber-tooth morphology
Curr. Biol
35
:455–467
PubMed
Google Scholar
47.
Composition and species diversity in Paleocene and Eocene mammal assemblages: an empirical study
J. Vertebr. Paleontol
1
:367–388
Google Scholar
48.
Paleogene mammals: crises and ecological change
Biot response to Glob Chang last
145
:333–349
Google Scholar
49.
East of Eden: Asia as an important center of taxonomic origination in mammalian evolution
Bull. Carnegie Museum Nat. Hist
34
:5–39
Google Scholar
50.
The decline and extinction of Plesiadapiformes (Mammalia:? Primates) in North America: displacement or replacement?
Paleobiology
14
:410–431
Google Scholar
51.
Early Paleogene insectivore mammals of Asia and establishment of the major groups of Insectivora
Paleontol J
40
:S205–S405
Google Scholar
52.
Biotic response to global change: the last 145 million years
Cambridge University Press
Google Scholar
53.
East of Eden at the Paleocene/Eocene boundary
Science
295
:2028–2029
PubMed
Google Scholar
54.
Mammalian diversification bursts and biotic turnovers are synchronous with Cenozoic geoclimatic events in Asia
Proc. Natl. Acad. Sci
119
:e2207845119
PubMed
Google Scholar
55.
Radinskya yupingae a perissodactyl-like mammal from the Late Paleocene of China
The evolution of perissodactyls
:24–36
Google Scholar
56.
The fossil record of phenotypic integration and modularity: A deep-time perspective on developmental and evolutionary dynamics
Proc. Natl. Acad. Sci
112
:4891–4896
PubMed
Google Scholar
57.
Megafloral change in the early and middle Paleocene in the Williston Basin, North Dakota, USA
Palaeogeogr Palaeoclimatol Palaeoecol
298
:224–234
Google Scholar
58.
The broad footprint of climate change from genes to biomes to people
Science
354
:aaf7671
PubMed
Google Scholar
59.
A switch in jaw form–function coupling during the evolution of mammals
Philos. Trans. R. Soc. B Biol. Sci
378
:20220091
PubMed
Google Scholar
60.
A perspective from the Mesozoic: Evolutionary changes of the mammalian skull and their influence on feeding efficiency and high-frequency hearing
Anat Rec
:1–16
PubMed
Google Scholar
61.
Trends, rhythms, and aberrations in global climate 65 Ma to present
Science
292
:686–693
PubMed
Google Scholar
62.
The Paleogene Period (Chapter 28)
In:
Gradstein F. M.
Ogg J. G.
Schmitz M. D.
Ogg G. M.
, editors.
Geological Time Scale
Elsevier
pp. 1087–1140
Google Scholar
63.
Revised calibration of the geomagnetic polarity timescale for the Late Cretaceous and Cenozoic
J. Geophys. Res. Solid Earth
100
:6093–6095
Google Scholar
64.
Introducing molaR: a New R Package for Quantitative Topographic Analysis of Teeth (and Other Topographic Surfaces)
J. Mamm. Evol
23
:397–412
Google Scholar
65.
Comparing Dirichlet normal surface energy of tooth crowns, a new technique of molar shape quantification for dietary inference, with previous methods in isolation and in combination
Am. J. Phys. Anthropol
145
:247–261
PubMed
Google Scholar
66.
Dental topographic proxies for ecological characteristics in carnivoran mammals
J. Anat
242
:627–641
PubMed
Google Scholar
67.
The landscape of tooth shape: Over 20 years of dental topography in primates
Evol Anthropol Issues News Rev
29
:245–262
PubMed
Google Scholar
68.
High-level similarity of dentitions in carnivorans and rodents
Nature
445
:78–81
PubMed
Google Scholar
69.
Dental complexity and diet in amniotes: A meta-analysis
PLoS One
19
:e0292358
PubMed
Google Scholar
70.
Beyond Description: The Many Facets of Dental Biomechanics
Integr Comp Biol
60
:594–607
PubMed
Google Scholar
71.
How mammalian molar teeth work
Discovery
5
:23–34
Google Scholar
72.
Rolling of the jaw is essential for mammalian chewing and tribosphenic molar function
Nature
566
:528–532
PubMed
Google Scholar
73.
Studies of the earliest mammalian dentitions
Dent Cosm
78
:791–800
Google Scholar
74.
Developmental process of the modern house shrew’s molars: implications for the evolution of the tribosphenic molar in Mesozoic mammals
Evolution
78
:463–479
PubMed
Google Scholar
75.
The Wear and Tear of Teeth
Med. Princ. Pract
24
:3–13
Google Scholar
76.
The Materials of Mastication: Material Science of the Humble Tooth
Integr Comp Biol
59
:1681–1689
PubMed
Google Scholar
77.
Finite element modeling of occlusal variation in durophagous tooth systems
J. Exp. Biol
218
:2705–2711
PubMed
Google Scholar
78.
Three-dimensional dental topography and feeding ecology in the extinct cave bear
Biol. Lett
16
:20200792
PubMed
Google Scholar
79.
Taking a stab at modelling canine tooth biomechanics in mammalian carnivores with beam theory and finite-element analysis
R Soc Open Sci
9
:220701
PubMed
Google Scholar
80.
Craniodental traits predict feeding performance and dietary hardness in a community of Neotropical free-tailed bats (Chiroptera: Molossidae)
Funct Ecol
36
:1690–1699
Google Scholar
81.
The biomechanics of tooth strength: testing the utility of simple models for predicting fracture in geometrically complex teeth
J. R. Soc. Interface
20
PubMed
Google Scholar
82.
On the Relationship Between Tooth Shape and Masticatory Efficiency: A Finite Element Study
Anat Rec
299
:679–687
PubMed
Google Scholar
83.
Mammalian dental function and wear: A review
Biosurface and Biotribology
1
:25–41
Google Scholar
84.
Enamel Thickness and Dietary Adaptation among Extant Primates and Chiropterans
J. Mammal
76
:1127–1136
Google Scholar
85.
Variations in molar enamel thickness among primates
J. Hum. Evol
35
:507–522
PubMed
Google Scholar
86.
Requirements for comparing the performance of finite element models of biological structures
J. Theor. Biol
256
:96–103
PubMed
Google Scholar
87.
Elastic modulus and stress–strain response of human enamel by nano-indentation
Biomaterials
27
:4388–4398
PubMed
Google Scholar
88.
The functional significance of morphological changes in the dentitions of early mammals
J. R. Soc. Interface
13
:20160713
PubMed
Google Scholar
89.
Fracture in teeth—a diagnostic for inferring bite force and tooth function
Biol. Rev
86
:959–974
PubMed
Google Scholar
90.
How does selection operate on whole-organism functional performance capacities? A review and synthesis
Evol Ecol Res
10
:177–196
Google Scholar
91.
R: A Language and Environment for Statistical Computing
92.
geomorph: an r package for the collection and analysis of geometric morphometric shape data
Methods Ecol. Evol
4
:393–399
Google Scholar
93.
Studying morphological integration and modularity at multiple levels: concepts and analysis
Philos. Trans. R. Soc. B Biol. Sci
369
:20130249
PubMed
Google Scholar
94.
New paleomagnetic and stable-isotope results from the Nanxiong Basin, China: implications for the K/T boundary and the timing of Paleocene mammalian turnover
J. Geol.
118
:131–143
Google Scholar
95.
Paleoenvironment of Eocene Red Beds in the Nanxiong Basin
Trop. Geogr
39
:218–228
Google Scholar
96.
The red beds and paleontology of Nanxiong Basin
Beijing
:
Huaxia Publishing House
Google Scholar
97.
A possible causal relationship between extinction of dinosaurs and K/T iridium enrichment in the Nanxiong Basin, South China: evidence from dinosaur eggshells
Palaeogeogr Palaeoclimatol Palaeoecol
178
:1–17
https://doi.org/10.1016/S0031-0182(01)00361-3
Google Scholar
98.
Evaluation of the four potential Cretaceous-Paleogene (K-Pg) boundaries in the Nanxiong Basin based on evidences from volcanic activity and paleoclimatic evolution
Sci. China Earth Sci
64
:631–641
Google Scholar
99.
Asian early Paleogene chronology and mammalian faunal turnover events
Vertebr Palasiat
49
:1–28
Google Scholar
100.
An integrated stratigraphic record from the Paleocene of the Chijiang Basin, Jiangxi Province (China): Implications for mammalian turnover and Asian block rotations
Earth Planet Sci Lett
269
:554–564
Google Scholar
101.
Out of Tibet: Pliocene Woolly Rhino Suggests High-Plateau Origin of Ice Age Megaherbivores
Science
333
:1285–1288
PubMed
Google Scholar
102.
Paleogene mammals: crises and ecological change
Biot response to Glob Chang last
145
:333–349
Google Scholar
103.
The global vegetation pattern across the Cretaceous–Paleogene mass extinction interval: a template for other extinction events
Glob Planet Change
122
:29–49
Google Scholar
104.
Paleogene mammalian fauna exchanges and the paleogeographic pattern in Asia
Sci. China Earth Sci
63
:202–211
Google Scholar
105.
Island life in the Cretaceous-faunal composition, biogeography, evolution, and extinction of land-living vertebrates on the Late Cretaceous European archipelago
Zookeys
469
:1–161
PubMed
Google Scholar
106.
The oldest Cenozoic mammal fauna of Europe: implication of the Hainin reference fauna for mammalian evolution and dispersals during the Paleocene
J. Syst. Palaeontol
15
:741–785
Google Scholar
107.
Direct stratigraphic dating of India-Asia collision onset at the Selandian (middle Paleocene, 59±1 Ma)
Geology
43
:859–862
Google Scholar
108.
Early Paleogene stratigraphic sequences, mammalian evolution and its response to environmental changes in Erlian Basin, Inner Mongolia, China
Sci. China Earth Sci
53
:1918–1926
Google Scholar
109.
Flat latitudinal gradient in Paleocene mammal richness suggests decoupling of climate and biodiversity
Geology
39
:163–166
Google Scholar
110.
Mammal community structure through the Paleocene-Eocene thermal maximum
Am. Nat
196
:271–290
PubMed
Google Scholar
111.
Evolution of Chinese mammalian faunal regions and elevation of the Qinghai-Xizang (Tibet) Plateau
Sci. China Ser. D Earth Sci.
48
:1246–1258
Google Scholar
112.
East of Eden: Asia as an important center of taxonomic origination in mammalian evolution
Bull. Carnegie Museum Nat. Hist
34
:5–39
Google Scholar
113.
Atlas of Earth History, Volume 1, Paleogeography
Arlington, Texas
:
PALEOMAP Project
Google Scholar
Tooth mesh and finite element models of Paleocene Asian placental mammals
figshare
Article and author information
Author information
Version history
Sent for peer review
:
Preprint posted
:
Reviewed Preprint version 1
:
Reviewed Preprint version 2
:
Cite all versions
You can cite all versions using the DOI
10.7554/eLife.108917
. This DOI represents all versions, and will always resolve to the latest one.
Copyright
© 2025,
Tseng et al.
This article is distributed under the terms of the
Creative Commons Attribution License
, which permits unrestricted use and redistribution provided that the original author and source are credited.
Metrics
views
427
downloads
34
citations
0
Views, downloads and citations are aggregated across all versions of this paper published by eLife.


