
 五度妙笔
五度妙笔 企业透视镜
企业透视镜 API商城
API商城
 数据库
数据库Mitochondrial metabolic remodeling drives innate immune activation inhemocytes
Abstract
Innate immune cells rapidly reprogram their metabolism upon activation, yet the metabolic basis of this flexibility in invertebrate systems remains largely unexplored. Here, we investigate the metabolic landscape of
Drosophila
larval hemocytes, functional analogs of vertebrate myeloid cells, across developmental stages, genotypes, and immune activation states, by combining metabolic flux measurements with single-cell transcriptomics. Under homeostatic conditions, hemocytes rely predominantly on mitochondrial oxidative phosphorylation for ATP production, with minimal glycolytic contribution. Immune activation, particularly lamellocyte differentiation, drives enhanced mitochondrial respiration and metabolic flexibility, accompanied by structural remodeling of the mitochondrial network. Mechanistically, functional lamellocytes require Drp1-mediated mitochondrial fission and utilize glucose and trehalose as primary carbon sources to sustain mitochondrial respiration, which is essential for effective immune responses. Overall, these findings establish that mitochondrial metabolic reprogramming is a conserved feature of innate immune activation in myeloid-like immune cells and reveal an evolutionarily ancient link between mitochondrial dynamics and immune cell activation, with implications for understanding metabolic regulation of innate immunity in invertebrate models and beyond.
Introduction
Drosophila
blood cells, called hemocytes, are functionally and developmentally analogous to vertebrate myeloid cells
1
. Their conserved yet simple characteristics make hemocytes an attractive invertebrate model for studying hematopoiesis and innate immunity
2
.
Drosophila
hemocytes were initially categorized based on their morphologies
3
and subsequent studies refined these classifications using marker gene expressions and their biological functions
4
. Most recently, single-cell RNA sequencing (scRNA-seq) analysis allowed a detailed classification of
Drosophila
larval hemocytes, and several studies have provided in-depth insights into the heterogeneity of
Drosophila
hemocyte populations at a transcriptome level
5
–
9
. Three classic types of mature hemocytes have been identified in
Drosophila
larvae: plasmatocytes, crystal cells, and lamellocytes
2
. Plasmatocytes represent up to 95 % of larval hemocytes and function in phagocytosis, antimicrobial peptide expression, and tissue remodeling, similar to macrophages in vertebrates
10
,
11
. Crystal cells facilitate wound healing and blood clotting and account for 2 ∼ 5 % of embryonic and larval hemocytes
12
,
13
. Recently, crystal cells have been shown to regulate internal oxygen homeostasis, in collaboration with the trachea
14
. Lamellocytes are a rarely found in healthy animals but arise during immune or stress responses, where they play a role in encapsulation and melanization
15
–
17
.
Similar to vertebrates,
Drosophila
develops hemocytes by two independent lineages: the embryonic lineage, which originates from the embryonic head mesoderm
10
, and the lymph gland lineage, which arises from the cardiogenic mesoderm
11
,
18
,
19
. Embryonically derived hemocytes, known as embryonic hemocytes, proliferate and differentiate primarily into plasmatocytes and migrate throughout the embryo to participate in embryogenesis
10
,
20
,
21
. During larval stages, these hemocytes either circulate in the hemolymph or colonize tissue microenvironments, where they continue to proliferate and differentiate
22
,
23
. The second wave of
Drosophila
hematopoiesis occurs in the lymph gland, which contains hematopoietic progenitors and their microenvironment niche. Lymph gland hemocytes eventually differentiate and disintegrate at the onset of pupariation
18
,
19
,
24
–
26
. Hemocytes from both lineages persist through the pupal and adult stages to continue to provide immune surveillance
27
.
An effective immune response demands significant energy, which necessitates enhanced nutritional uptake, metabolic reprogramming of immune cells, and redistribution of body resources. Thus, coordination between metabolism and immunity is critical for effective immune responses and host survival, particularly during infection, across the animal kingdom. In
Drosophila
, the fat body serves as the primary organ for nutrient storage, metabolism, and humoral immunity. Upon immune activation, the fat body allocates stored energy to immune effectors, including hemocytes, to support the acute phase of immune responses
28
–
30
. It also regulates the number, location, and activation of hemocytes in response to systemic metabolic states
31
–
33
, thereby controlling overall metabolic homeostasis during immunity. In addition to the fat body, muscles play a key role by modulating whole-animal insulin and JAK/STAT pathways and by storing glycogen required for robust innate immune responses
34
–
36
. Recent findings have revealed that hemocytes are not merely passive recipients of energy but also act as active regulators, establishing bi-directional communication with other tissues to adjust energy distribution through multiple signaling pathways
30
,
32
,
37
–
39
. This is supported by recent single-cell transcriptome analyses
5
–
7
,
9
, which showed that larval hemocyte subtypes express high levels of metabolism-related genes, implying the significance of hemocytes in bridging metabolism and immunity.
Despite the growing evidence for metabolic shifts in hemocytes under various developmental or stress conditions, and the significance of hemocytes in the crosstalk between immunity and metabolism, their metabolic profiles under steady-state or immune-activated conditions remain poorly characterized. In this study, we measured metabolic parameters of
Drosophila
larval hemocytes at various developmental timepoints, genotypes, both with and without immune activation. We identified that mitochondrial respiration drives metabolic activation in larval hemocytes. Hemocytes are metabolically dormant under homeostatic conditions but switch to an active state through mitochondrial activation. Furthermore, we demonstrated that lamellocytes exhibit unique metabolic activities, including enhanced trehalose catabolism and mitochondrial remodeling, required for their encapsulation response. Together, our study demonstrates the mitochondria-dependent metabolic activities of
Drosophila
larval hemocytes and their functional relevance in innate immunity.
Result
Hemocytes rely on mitochondrial respiration
To understand the metabolic characteristics of embryonically derived hemocytes in larvae, we measured metabolic parameters, including oxygen consumption rate (OCR) and extracellular acidification rate (ECAR), of larval hemocytes using the Seahorse XFe96 Analyzer
40
. For the measurement of hemocytes, we adopted protocols from previous studies
41
–
43
and further optimized the process by exchanging the culture medium and filtering debris using a 40 μm cell strainer (see Methods). The validity of our modified protocol was verified by probing glycolytic signatures of larval brain as previously shown (
Supplementary Figure 1a
)
41
. To identify an optimal density of hemocytes in the measurement, we tested different numbers of live hemocytes – 0.43 x 10
6
cells/mL, 1.13 x 10
6
cells/mL, and 1.45 x 10
6
cells/mL – that represent 0.5x, 1x, and 1.5x ratio, and observed proportional increments of OCR or ECAR values in accordance with the absolute number of hemocytes (
Figure 1a-b
). Based on the correlation, we set the number of hemocytes per one well to 2.7 x 10
5
cells representing the optimal range of OCR or ECAR for each measurement without melanization. In the absence of drug application, hemocytes maintained constant OCR or ECAR up to 90-minute culture in the Seahorse analyzer, indicating that hemocytes are viable during the metabolic measurements within this time point (
Supplementary Figure 1b-c
).
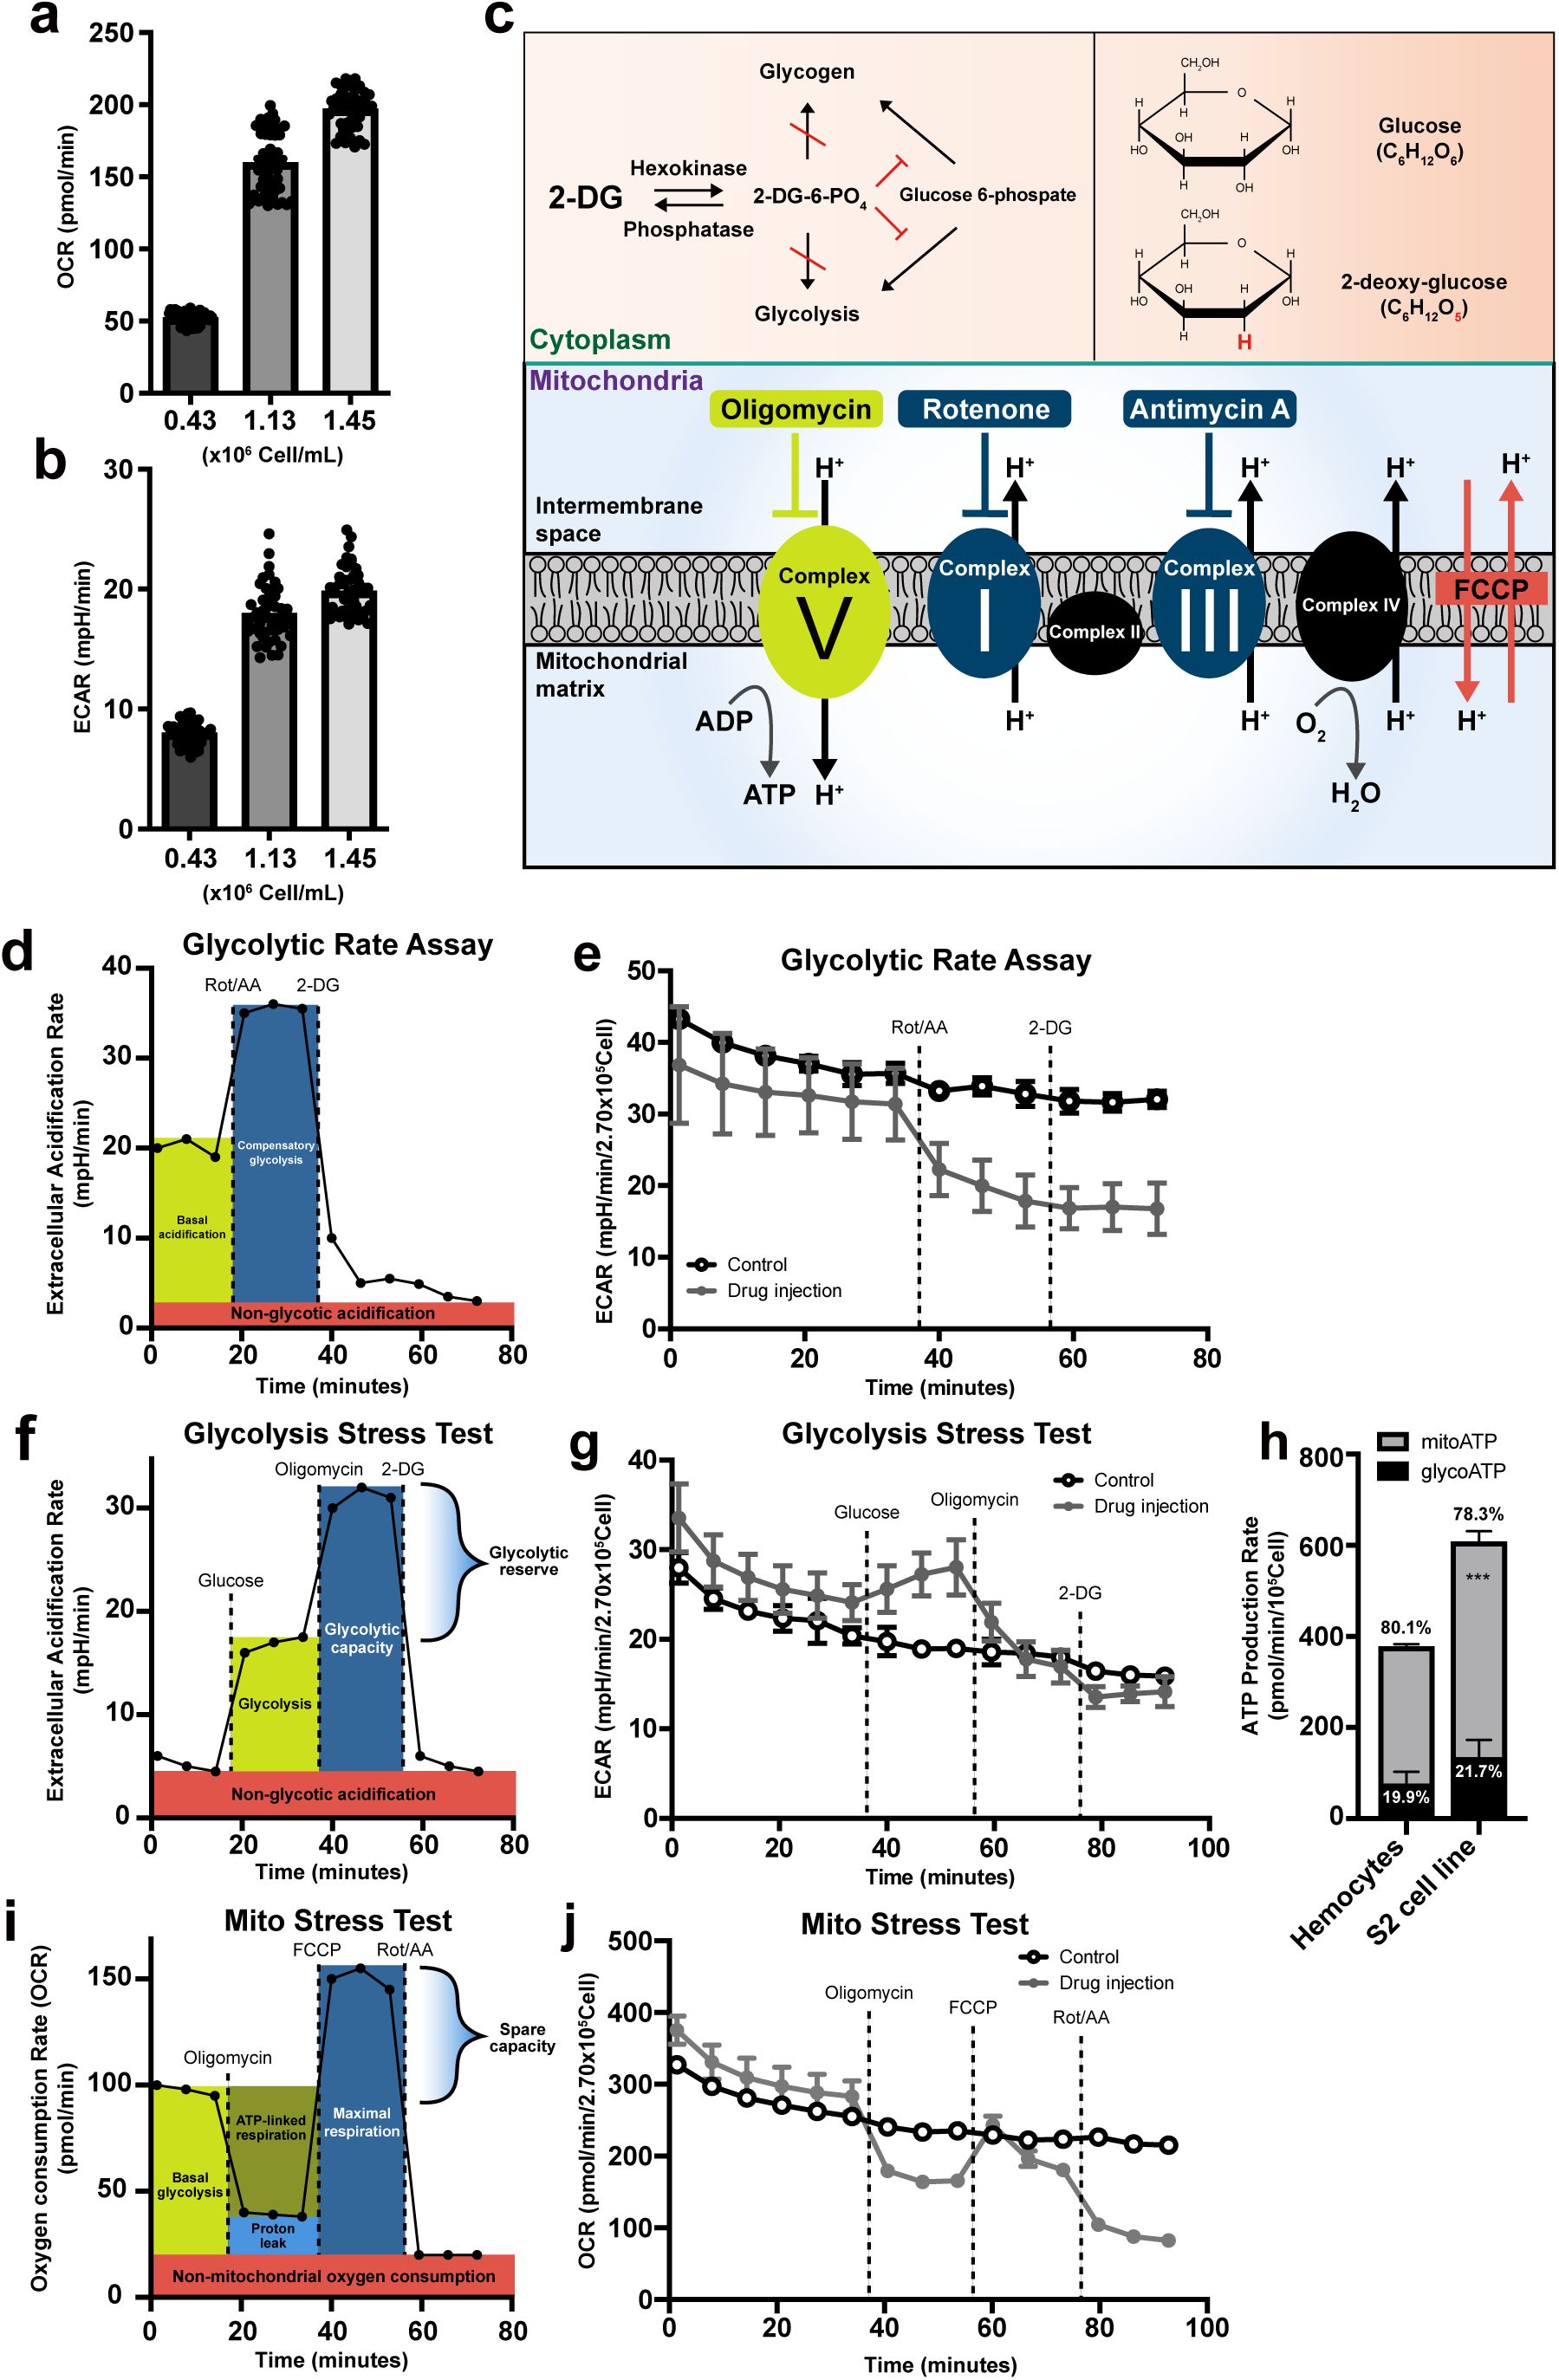
Metabolic analysis of
Drosophila
larval hemocytes
(a)
Oxygen consumption rates (OCR; pmol/min) and
(b)
extracellular acidification rates (ECAR; mpH/min) of hemocytes (
Hml
Δ
-Gal4, UAS-EGFP
) with different numbers (0.43 x 10
6
cell/ml, 1.13 x 10
6
cell/ml, and 1.45 x 10
6
cell/ml). OCR and ECAR increase in proportion to the number of hemocytes.
(c)
Schematic overview of metabolic inhibitors used in this study. 2-deoxy-glucose (2-DG), a competitive inhibitor of hexokinase, is a glucose analog that lacks the 2-hydroxyl group. Oligomycin inhibits mitochondria ATP synthase, Complex V. Rotenone or antimycin A inhibit electron transport chain complex I or complex II, respectively. Carbonyl cyanine-4 (trifluoromethoxy) phenylhydrazone (FCCP) is an uncoupling chemical that decreases the proton gradient between mitochondria intermembrane space and mitochondrial matrix.
(d)
Representative Seahorse glycolytic rate assay profile. At baseline, ECAR reflects both glycolytic proton efflux and mitochondrial-derived CO
2
hydration. Inhibition of mitochondrial respiration with rotenone and antimycin A (Rot/AA) induces ECAR via elevated compensatory glycolysis. Subsequent 2-DG injection suppresses ECAR sustained by glycolysis. The assay medium for Seahorse glycolytic rate assay contains glucose, pyruvate, and glutamine allowing cells to utilize both glycolysis and mitochondrial respiration.
(e)
Seahorse glycolytic rate assay using embryonically derived hemocytes. Rot and AA were injected after the 6
th
measurement and 2-DG, after the 9
th
measurement (gray). No glycolytic compensation was observed following Rot/AA treatment. The control group (black) received assay medium at volumes matched to the Rot/AA or 2-DG injections.
(f)
Representative Seahorse glycolysis stress test profile. Glucose was injected to determine glycolysis-induced ECAR levels. Subsequent oligomycin injection inhibits mitochondrial ATP synthase and forces ATP production through glycolysis, indicating glycolytic capacity. Final 2-DG blocks glycolysis. The drop from pre-2-DG ECAR represents the amount of ECAR produced by glycolysis. The remaining ECAR reflects non-glycolytic acidification. The assay medium contains glutamine only (no glucose or pyruvate).
(g)
Seahorse XF glycolysis stress test using embryonically derived hemocytes. Glucose was injected after the 6
th
measurement, oligomycin after the 9
th
measurement, and 2-DG after 12
th
measurement (gray). Glucose injection marginally increased ECAR, which is subsequently blocked by oligomycin treatment. The final 2-DG injection did not change ECAR in hemocytes. The control group (black) received assay medium lacking glucose and pyruvate at volumes matched to the glucose or oligomycin injections.
(h)
ATP production rates of larval hemocytes and S2 cells calculated using the Seahorse real-time ATP rate assay. Hemocytes generated 19.9 % of ATP through glycolysis (glycoATP) and 80.1 % by mitochondrial respiration (mitoATP). S2 cells recapitulated this ratio, producing 21.7 % of glycoATP and 78.3 % via mitoATP.
(i)
Representative Seahorse cell mito stress test profile. The mito stress test measures the key parameters of mitochondrial function, including basal and maximal respiration rates and mitochondrial spare capacities. The oligomycin-induced drop in OCR reflects the ATP-linked mitochondrial respiration and the residual OCR, proton peak. Carbonyl cyanine-4 (trifluoromethoxy) phenylhydrazone (FCCP) injection uncouples the proton gradient across intermembrane and ATP synthesis that promotes maximal respiration of mitochondria.
(j)
Seahorse XF mito stress test using embryonically derived hemocytes. Oligomycin, FCCP, or Rot/AA was serially injected after the 6
th
, 9
th
, or 12
th
measurement, respectively (gray). Oligomycin injection reduced OCR, which was recovered by FCCP. Subsequent Rot/AA injection further reduced OCR. Controls (black) were injected with the same volume of mito stress test medium. In
(h)
, statistical analysis was performed using unpaired t-test. n.s: not significant (p > 0.05). *p < 0.05; **p < 0.01; ***p < 0.001. Bars in graphs: the mean. Error bars: standard deviation.
To monitor the mitochondrial activity of hemocytes in the late third instar larvae, we introduced a series of oxidative phosphorylation (OXPHOS) complex inhibitors: oligomycin, rotenone, and antimycin A to hemocytes. Oligomycin, a potent ATP synthase (complex V) inhibitor, impairs the electron flow of the electron transport chain, reducing mitochondrial respiration or OCR
44
. Rotenone or antimycin A is a complex I or complex III inhibitor, respectively, and a mixture of the two compounds shuts down mitochondrial respiration and allows us to measure the non-mitochondrial OCR
45
,
46
. For measuring glycolysis, 2-deoxy-glucose (2-DG), a glucose analog, was used to competitively block hexokinase and its downstream metabolism
47
(
Figure 1c
). First, we carried out the glycolytic rate assay that accounts for compensatory glycolysis following mitochondrial inhibition
48
. Proton efflux in live cells is generated by two main pathways: glycolysis- and mitochondrial-derived acidification. Thus, if tissue is glycolytic, ECAR is significantly elevated after Rot/AA treatment due to compensatory activation of glycolytic proton production (
Figure 1d
). However, hemocytes considerably reduced ECAR by Rot/AA injection and did not respond to 2-DG (
Figure 1e
). Also, Rot/AA decreased OCR similar to the trend shown in ECAR (
Supplementary Figure 1d
), suggesting that OCR and ECAR in larval hemocytes are largely independent of glycolysis. Second, we performed the glycolysis stress test that provides key parameters of glycolytic function, including glycolytic capacity, glycolytic reserve, and non-glycolytic acidification. Most cells are able to switch between glycolysis and oxidative phosphorylation and glucose in cells is converted into pyruvate to be utilized in lactate production in the cytoplasm or TCA cycle. Therefore, glucose injection in a saturated concentration enhances ECAR through lactose dehydrogenase (Ldh)-mediated acidification of cells, which is further elevated by oligomycin treatment due to the lack of OXPHOS (
Figure 1f
). Hemocytes marginally induced ECAR upon glucose administration, which was suppressed by oligomycin but not by a following 2-DG injection (
Figure 1g
). Third, we substantiated these results by real-time ATP rate assay designed to measure total ATP production rates and quantitative bioenergetic balance in cells. Consistent with the glycolytic rate assay and glycolysis test, real-time ATP rate assay demonstrated that larval hemocytes generate ATP mainly by mitochondrial activities (mitoATP, 80.1 %) with a minor contribution of glycolysis (glycoATP, 19.9 %) (
Figure 1h
;
Supplementary Figure 1e-f
). In addition to hemocytes from
w
1118
wild-type animals used for the above experiments, we ran real-time ATP rate assay with hemocyte-derived
Drosophila
S2 cells and hemocytes from different genetic backgrounds, including
Oregon R
and
Hml
Δ
-gal4 UAS-EGFP
, and obtained similar mitochondria-dependent ATP production rates (
Figure 1h
;
Supplementary Figure 1g-k
). Finally, mito stress test was used to further investigate a key parameter of mitochondrial functions. Oligomycin decreases electron flow through the electron transport chain (ETC) and FCCP lifts limits of the ECT maximizing oxygen consumption by complex IV (
Figure 1i
). Mito stress test using hemocytes revealed that FCCP injection did not lead to a rebound in OCR higher than basal levels (
Figure 1j
), suggesting that hemocytes do not hold the spare mitochondrial capacity, a functional parameter for mitochondrial reserve. Taken together, we conclude that embryonically derived hemocytes in
Drosophila
larvae predominantly utilize mitochondrial respiration to generate energy and exhibit minimal glycolysis rates under unchallenged conditions.
Metabolic activities of hemocytes change over development
Previous studies have indicated that hemocytes of the embryo are released into the hemolymph upon hatching and undergo an extensive proliferation during the second to third instars
11
,
22
,
49
. Hemocytes at the late third instar right before pupariation could be less proliferative than those in earlier stages, and therefore, may differ in their metabolism. Based on the proliferation profile of hemocytes, we reasoned whether hemocytes experience metabolic fluctuations during larval development. To assess developmental changes in larval hemocyte metabolism during the second and third instars, we measured OCR or ECAR of larval hemocytes at 72 h, 96 h, or 120 h after egg laying (AEL), representing mid-second, early third, and late third instars, respectively. With the real-time ATP rate assay, we observed that hemocytes at 96 h AEL generate larger ATP production rate than those in 72 h or 120 h AEL (
Figure 2a
,
Supplementary Figure 2a-b
). At all stages, ATP production relied heavily on mitochondrial respiration, and the proportion of glycolysis-mediated ATP generation remained low, which rather diminished over development (
Figure 2a
). Consistently, ATP-linked respiration corresponded well with the ATP production rate (
Figure 2b
). This phenotype was recapitulated by biochemical ATP measurement assay (
Supplementary Figure 2b
). Proton leak, an indicator for mitochondrial fitness, decreased over time (
Figure 2c
). Furthermore, hemocytes did not respond to 2-DG at all developmental time points (
Supplementary Figure 2c
). These results indicate that mitochondrial respiration is the main process for hemocyte metabolism and ATP production peaks at 96 h AEL during hemocyte development.
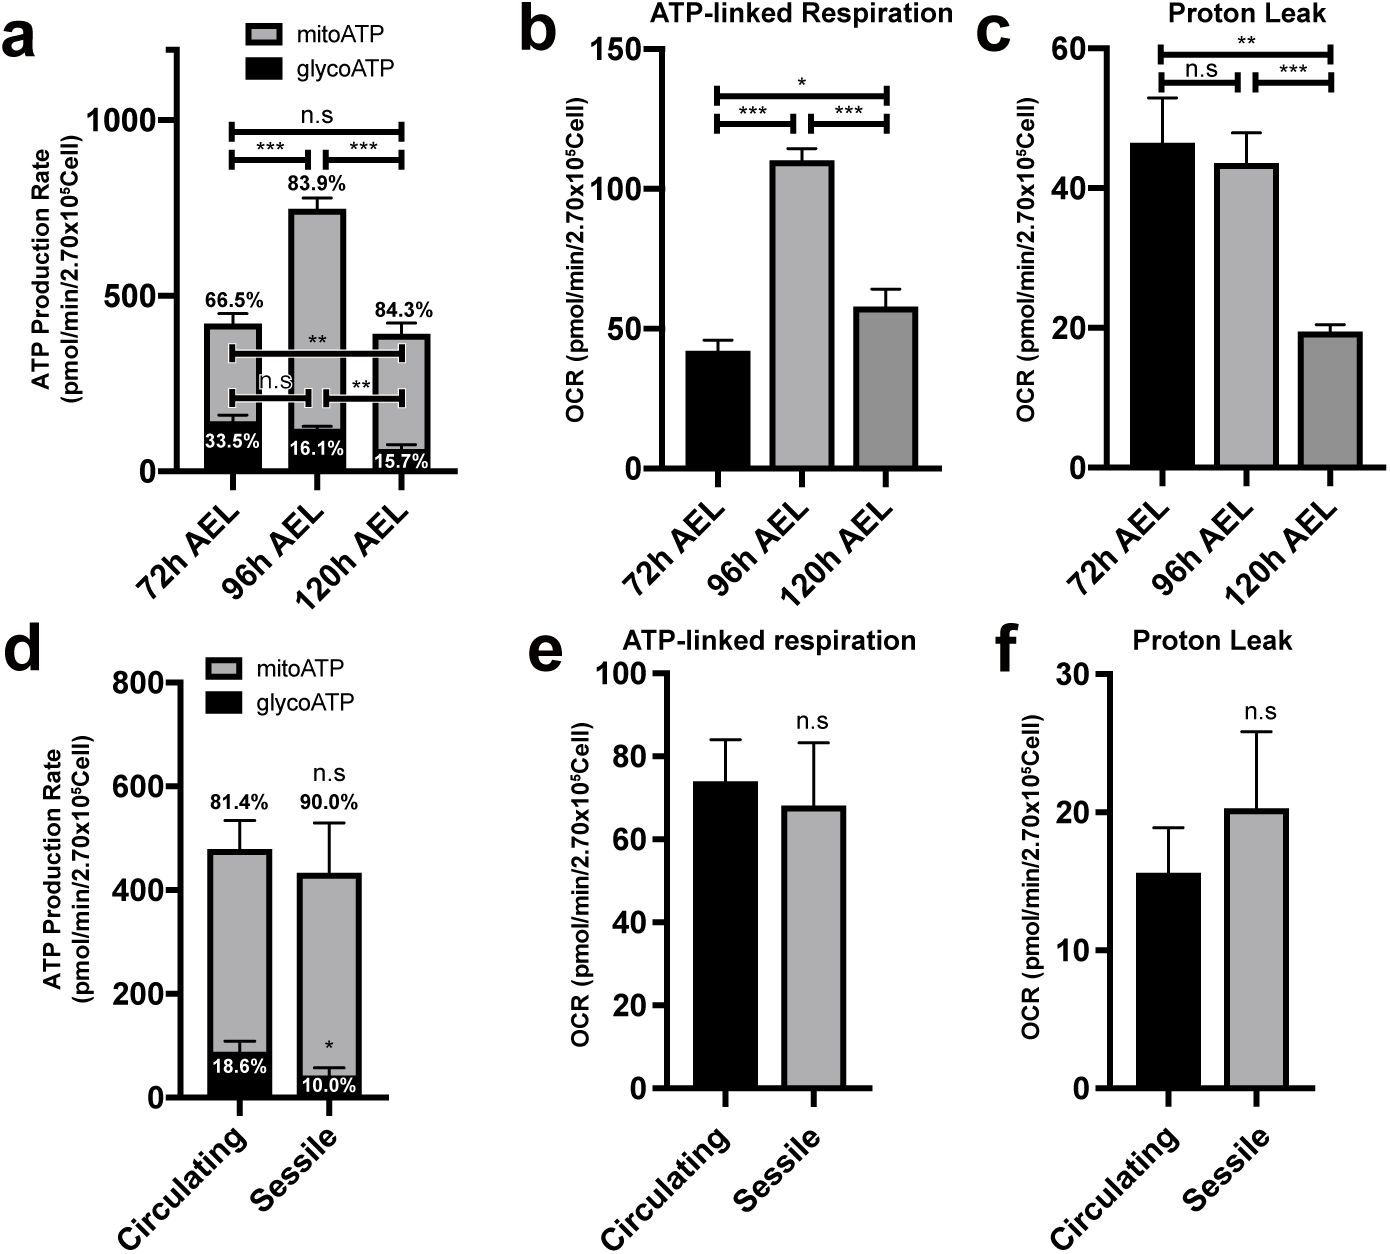
Metabolic variations of hemocytes during larval development
(a)
ATP production rate of
Drosophila
larval hemocytes at different developmental timepoints. Hemocytes at 72 h after egg laying (AEL) produce 33.5% ATP by glycolysis and 66.5 % by mitochondrial respiration. At 96 h AEL, hemocytes exhibit 16.1 % of glycoATP and 83.9% of mitoATP production rates and generate larger amount of ATP than 72 h or 120 h. Hemocytes at 120 h AEL express 15.7 % of glycoATP and 84.3 % of mitoATP production rates. The ratio of glycoATP reduces over development.
(b)
ATP-linked respiration levels of hemocytes at 72 h, 96 h, and 120 h AEL. OCR is the highest at 96 h AEL.
(c)
Proton leak levels of larval hemocytes at different developmental timepoints. Proton leak gradually decreases during development.
(d)
ATP production rates of circulating or sessile hemocytes. Circulating hemocytes display 18.6 % of glycoATP and 81.4 % of mito ATP production rates. Sessile hemocytes show 10.0 % of glycoATP and 90.0 % of mitoATP production rates.
(e)
ATP-linked respiration levels of circulating or sessile hemocytes. ATP-linked respiration levels are indistinguishable in circulating or sessile hemocytes.
(f)
Proton leak levels of circulating or sessile hemocytes. Circulating or sessile hemocytes exhibit similar proton leak levels. In
(a)
to
(f)
statistical analysis was performed using unpaired t-test. n.s: not significant (p > 0.05). *p < 0.05; **p < 0.01; ***p < 0.001. Bars in graphs: the mean. Error bars: standard deviation.
Upon hatching, larval hemocytes either freely circulate the larval hemolymph or colonize resident tissues including hematopoietic pockets of the larval body wall to control their proliferation and differentiation
50
. Considering that hemocyte metabolism is modified during larval development, we asked whether circulating or sessile hemocytes display differential cellular metabolism due to their distinct microenvironment. Glycolysis-mediated ATP production was lower in sessile hemocytes (10 %) than in circulating hemocytes (18.6 %) (
Figure 2d
). However, most metabolic profiles, such as ATP production, ATP-linked respiration, and proton leak, were comparable regardless of the hemocyte location (
Figure 2e-f
;
Supplementary Figure 2d-e
). Overall, we conclude that hemocytes developmentally elevate ATP production rates at 96 h AEL and that hemocytes at two locations – sessile and circulating – are metabolically indistinguishable.
Hemocyte proliferation enhances mitochondrial respiration
Our findings indicate that larval hemocytes rely on mitochondrial respiration without reserving spare mitochondrial capacities. However, metabolic activities of hemocytes fluctuate during larval development, implying that these cells are able to transform cellular metabolism according to bioenergetic requirements. Based on this, we sought to understand the metabolic signatures of hemocytes in various genetic backgrounds that promote the proliferation or differentiation of hemocytes or upon immune challenges. First, we investigated whether induced proliferation alters hemocyte metabolism by using an active form of
Ras
,
UAS-Ras
v12
(
Hml
Δ
-Gal4 UAS-Ras
v12
). We confirmed that late-third instar larvae carrying both transgenes show over a 10-fold increase in the number of
Hml
+
plasmatocytes with a relatively minor proportion of lamellocytes differentiation (
Supplementary Figure 3a-b
). A fixed number of hemocytes (2.7 x 10
5
cells) expressing
Ras
v12
exhibited 2-fold higher basal OCR or ECAR levels than those in controls, which was significantly decreased to non-mitochondrial OCR levels following oligomycin and Rot/AA injections (
Supplementary Figure 3c-d
). Additionally, the expression of
Ras
v12
considerably enhanced the ATP production rate without changing the preference for mitochondrial respiration over glycolysis (
Figure 3a
). Both ATP-linked respiration (
Figure 3b
) and proton leak (
Figure 3c
) were increased in this genetic background. Different from wild-type hemocytes, hemocytes expressing
Ras
v12
showed higher OCR rebound than basal levels following the FCCP treatment (
Figure 3d
), indicating that
Ras
v12
-expressing hemocytes elevate the spare respiratory capacity. Thus, we conclude that
Ras
v12
-expressing hemocytes rewire mitochondrial capacities as well as energetic activities.
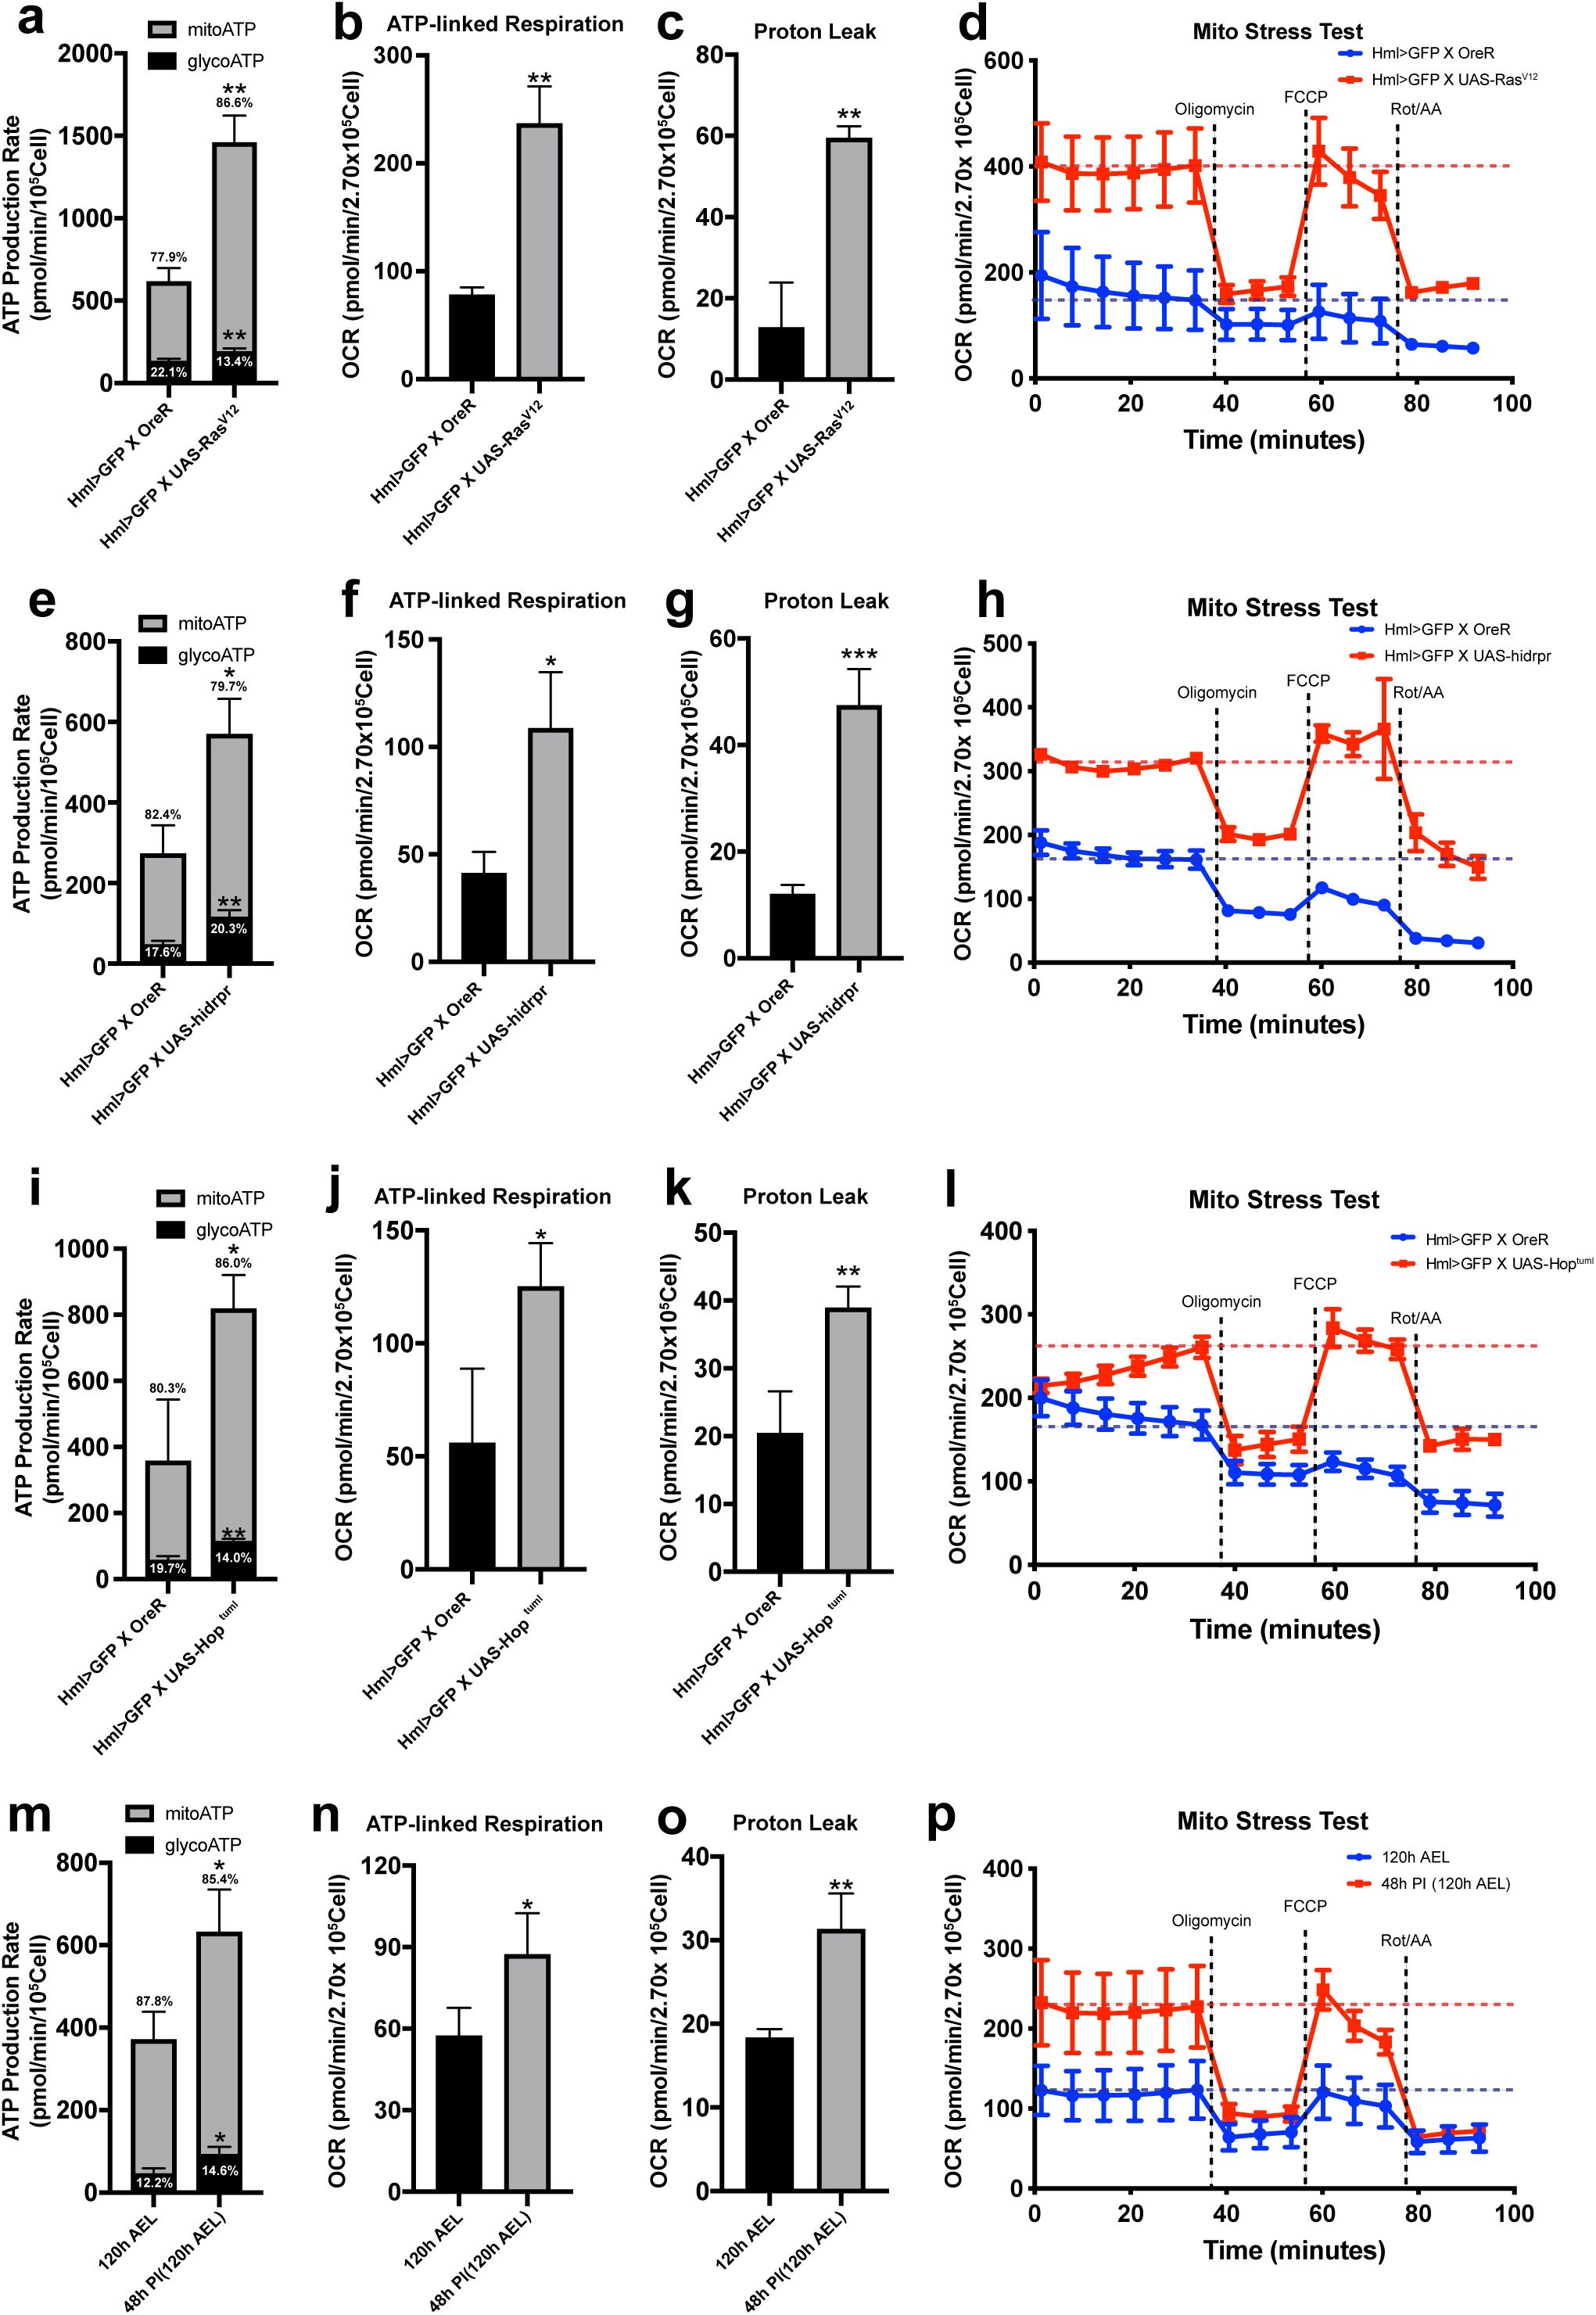
Metabolic changes of hemocytes in multiple genetic backgrounds or upon wasp infestation
(a)
ATP Production Rate of wild-type (
Hml
Δ
-Gal4, UAS-EGFP/+
) or
Ras
v12
-expressing hemocytes (
Hml
Δ
-Gal4, UAS-EGFP; UAS-Ras
V12
) calculated by Seahorse XF real-time ATP rate assay. Wild-type hemocytes display 22.1 % of glycoATP and 77.9 % of mito ATP production rates while hemocytes expressing
Ras
v12
exhibit 13.4 % of glycoATP and 96.6 % of mitoATP.
Ras
v12
-expressing hemocytes express higher ATP production rates than wildtype.
(b)
ATP-linked respiration levels of wild-type hemocytes (
Hml
Δ
-Gal4, UAS-EGFP/+
) or
Ras
v12
-expressing hemocytes (
Hml
Δ
-Gal4, UAS-EGFP; UAS-Ras
V12
).
(c)
Proton leak levels of hemocytes of wildtype (
Hml
Δ
-Gal4, UAS-EGFP/+
) or
Ras
v12
-expressing hemocytes (
Hml
Δ
-Gal4, UAS-EGFP; UAS-Ras
V12
).
(d)
Mito stress test measuring OCR levels of wildtype (
HmlΔ-Gal4, UAS-EGFP/+
; blue) or
Ras
v12
-expressing hemocytes (
Hml
Δ
-Gal4, UAS-EGFP;UAS-Ras
V12
; red).
(e)
ATP production rate of wildtype (
Hml
Δ
-Gal4, UAS-EGFP/+
) or caspase-expressing hemocytes (
Hml
Δ
-Gal4, UAS-EGFP; UAS-hid,rpr
) calculated by Seahorse XF real-time ATP rate assay. Wild-type hemocytes express 22.1% of glycoATP and 77.9% of mito ATP production rates. Genetic ablation of
Hml
+
hemocytes leads to 13.4% of glycoATP and 13.4% of mitoATP production rates with higher ATP production rates than wild type.
(f)
ATP-linked respiration levels of wildtype (
Hml
Δ
-Gal4, UAS-EGFP/+
) or caspase-expressing hemocytes (
Hml
Δ
-Gal4, UAS-EGFP; UAS-hid,rpr
).
(g)
Proton leak levels of hemocytes from wildtype (
Hml
Δ
-Gal4, UAS-EGFP/+
) or caspase-expressing hemocytes (
Hml
Δ
-Gal4, UAS-EGFP; UAS-hid,rpr
).
(h)
Mito stress test measuring OCR levels of wildtype (
HmlΔ-Gal4, UAS-EGFP/+
; blue) or caspase-expressing hemocytes (
Hml
Δ
-Gal4, UAS-EGFP; UAS-hid,rpr
; red).
(i)
ATP production rate of wild-type (
Hml
Δ
-Gal4, UAS-EGFP/+
) or hemocytes expressing
hop
Tum-l
(
Hml
Δ
-Gal4, UAS-EGFP; UAS-hop
Tum-l
) measured by Seahorse XF real-time ATP rate assay. Wild type hemocytes express 19.7 % of glycoATP and 80.3 % of mito ATP production rates. Overexpression of
hop
Tum-l
in hemocytes results in 14.0 % of glycoATP and 86.0 % of mitoATP production rate and higher ATP production rates.
(j)
ATP-linked respiration of wildtype (
Hml
Δ
-Gal4, UAS-EGFP/+
) or
hop
Tum-l
-expressing hemocytes (
Hml
Δ
-Gal4, UAS-EGFP; UAS-hop
Tum-l
).
(k)
Proton leak levels of wildtype (
Hml
Δ
-Gal4, UAS-EGFP/+
) or
hop
Tum-l
-expressing hemocytes (
Hml
Δ
-Gal4, UAS-EGFP; UAS-hop
Tum-l
).
(l)
Mito stress test measuring OCR levels of wildtype (
Hml
Δ
-Gal4, UAS-EGFP/+
; blue) or
hop
Tum-l
-expressing hemocytes (
Hml
Δ
-Gal4, UAS-EGFP; UAS-hop
Tum-l
; red).
(m)
ATP production rate of hemocytes (
Hml
Δ
-Gal4, UAS-EGFP
) at 120 h AEL or 48 h post-infestation (48 h PI; equivalent to 120 h AEL) measured by Seahorse XF real-time ATP rate assay. Wild-type hemocytes express 12.2 % of glycoATP and 87.8 % of mito ATP production rates. Immune-activated hemocytes show 14.6 % of glycoATP and 85.4 % of mitoATP production rates with higher ATP production rates than unchallenged controls.
(n)
ATP-linked respiration levels of control hemocytes at 120 h AEL or 48 h PI.
(o)
Proton leak levels of hemocytes at 120 h AEL or 48 h PI.
(p)
Mito stress test measuring OCR levels of hemocytes at 120 h AEL (blue) and 48 h PI (equivalent to 120 h AEL; red). In
(d)
,
(h)
,
(l)
, and
(p)
, oligomycin, FCCP, and Rot/AA were injected after 6
th
, 9
th
, or 12
th
measurement, respectively. Blue or red dashed line indicates average OCR levels from 1
st
to 6
th
cycle measurement. In
(a)-(c)
,
(e)-(g)
,
(i)-(k),
and
(m)-(o)
, statistical analysis was performed using unpaired t-test. n.s: not significant (p > 0.05). *p < 0.05; **p < 0.01; ***p < 0.001. Bars in graphs: the mean.Error bars: standard deviation.
Recent studies including single-cell transcriptome analyses of larval hemocytes indicated that larval plasmatocytes are composed of transcriptionally diverse subtypes, in addition to the
Hml
+
population
5,6
. To test whether every plasmatocyte, regardless of its subtype represented by a marker gene expression, displays similar metabolic profiles during proliferation, we expanded
Hml
-
plasmatocytes by genetically ablating
Hml
+
plasmatocytes. Expression of the pro-apoptotic genes
hid
and
rpr
in
Hml
+
plasmatocytes (
Hml
Δ
-Gal4 UAS-hid,rpr
) reduces the number of
Hml
+
plasmatocytes while expanding
Hml
-
but
Pxn
+
plasmatocytes
51
. Similar to
Ras
v12
-expressing
Hml
+
plasmatocytes,
Hml
-
Pxn
+
plasmatocytes exhibited higher basal OCR or ECAR rates (
Supplementary Figure 3e-f
). These rates sharply declined following oligomycin and Rot/AA treatment in a similar trend seen by those expressing
Ras
v12
(
Supplementary Figure 3e-f
). Consistently, ATP production rates (
Figure 3e
), ATP-linked respiration (
Figure 3f
), proton leak (
Figure 3g
), and the spare respiratory capacity (
Figure 3h
) were all increased, demonstrating that proliferation of plasmatocytes, regardless of their subtypes, augments hemocyte metabolism.
Lastly, we assessed the metabolic activities of crystal cells, the second largest population under normal growing conditions. Since crystal cells comprise only ∼ 5 % of total hemocytes, we increased their proportion by accelerating crystal cell differentiation through
Notch
ICD
expression (
Hml
Δ
-Gal4 UAS-N
ICD
). Overexpression of
Notch
ICD
successfully expanded the crystal cell pool (
Supplementary Figure 3g
). However, number-matched
Notch
ICD
-expressing hemocytes displayed marginally decreased or similar metabolic levels comparable to control hemocytes, including ATP production, ATP-linked respiration, and proton leak (
Supplementary Figure 3h-j
). Moreover, the mito stress test was unchanged in this genetic background (
Supplementary Figure 3k
), suggesting
N
ICD
-expressing hemocytes with expanded crystal cell population exhibit lower metabolic activities than wild-type hemocytes.
Overall, these results establish that an increase in the number of plasmatocytes, but not crystal cells, is accompanied by enhanced respiratory activity and increased mitochondrial reserve.
Lamellocyte differentiation or active immunity triggers mitochondrial respiration
While plasmatocytes are the major hemocyte population under unchallenged conventional conditions, lamellocytes are the predominant cell type that give rise during active immunity or stress responses
15
,
16
. To gain further insights into the lamellocyte differentiation and mitochondrial function, we expressed a constitutively active form of the Janus kinase Hopscotch (
hop
Tum-l
) in hemocytes (
Hml
Δ
-gal4 UAS-hop
Tum-l
) to genetically induce a large number of lamellocytes (
Supplementary Figure 4a-c
)
17
,
52
,
53
. Hemocyte-specific expression of
hop
Tum-l
considerably elevated basal OCR or ECAR and raises ATP production rates, ATP-linked respiration, and proton leak (
Figure 3i-k
;
Supplementary Figure 4d-e
). Also, we detected spare respiratory capacities in
hop
Tum-l
expressing hemocytes similar to those found in
Ras
v12
-or
hid, rpr
-expressing hemocytes (
Figure 3l
).
Drosophila
larvae respond to wasp-egg deposition within a few hours and trigger a series of innate immune responses, including a massive differentiation of lamellocytes
54
. Immature lamellocytes appear by 24 h post-infestation (PI) and develop into mature lamellocytes by 48 h PI to encapsulate wasp eggs
5
,
55
. Given that proliferation or differentiation of hemocytes stimulated by gene expression alters hemocyte metabolism, we asked whether innate immunity caused by a natural infection influences hemocyte respiration. Hemocytes at 24 h PI when mature lamellocytes have not yet given rise showed OCR or ECAR levels similar to unchallenged controls at 96 h AEL and did not change other metabolic indicators (
Supplementary Figure 4f-g
). On the other hand, hemocytes at 48 h PI expressed significantly higher OCR or ECAR by two folds than wild-type hemocytes at 120 h AEL (
Supplementary Figure 4h-i
). Moreover, these hemocytes increased their ATP production rate, ATP-linked mitochondrial respiration, and proton leak (
Figure 3m-o
). The mito stress test recognized that hemocytes at 48 h PI result in elevated spare respiratory capacities (
Figure 3p
), suggesting that immune-activated hemocytes and mature lamellocytes amplify mitochondrial respiratory rates and capacity.
Overall, these data suggest that while larval hemocytes under unchallenged conditions rely largely on mitochondrial respiration and exhibit low metabolic activity, hemocyte proliferation, lamellocyte differentiation, or active immune responses significantly elevate mitochondrial as well as glycolytic activities to promote ATP production.
Rearrangement of mitochondrial structures in plasmatocytes and lamellocytes
Since metabolic alterations often accompany structural modifications of mitochondria
56
, we hypothesized that mitochondria in hemocytes undergo morphological or quantitative changes during hemocyte development or upon active immunity. To address this, we used
UAS-mitoGFP
to visualize mitochondrial morphology in embryonically derived hemocytes (
Srp-Gal4 UAS-mitoGFP
). Over larval development under unchallenged conditions, plasmatocytes experienced an increase in mitochondrial size during 72 to 96 h AEL and maintained the size until the third instar 120 h AEL (
Figure 4a-c
). In contrast, the number of mitochondria per one plasmatocyte decreased, particularly between 72 and 96 h AEL (
Figure 4a-c
); therefore, the total mitochondrial size per one plasmatocyte remained relatively constant throughout the developmental period. A stark morphological change during 72 to 96 h AEL corresponded well with fluctuations of metabolic parameters of hemocytes at this stage (
Figure 2a-c
), supporting that metabolic plasticity is associated with mitochondrial rearrangement. Under wasp parasitism, immature lamellocytes given rise at 24 h PI contained a markedly higher number of mitochondria with a smaller size than age-matched plasmatocytes at 96 h AEL (
Figure 4a-c
). At 48 h PI, mature lamellocytes marginally reduced the number of mitochondria but increased the average mitochondrial size compared to immature lamellocytes at 24 h PI (
Figure 4a-c
). These results suggest two different regulatory modes of mitochondrial plasticity in plasmatocytes and lamellocytes: developing plasmatocytes maintain relatively constant numbers of mitochondria with an increase in size during the second to third instar. However, lamellocytes undergo extensive mitochondrial fragmentation during the initial differentiation process, which is later attenuated and shifted towards the size expansion during maturation.
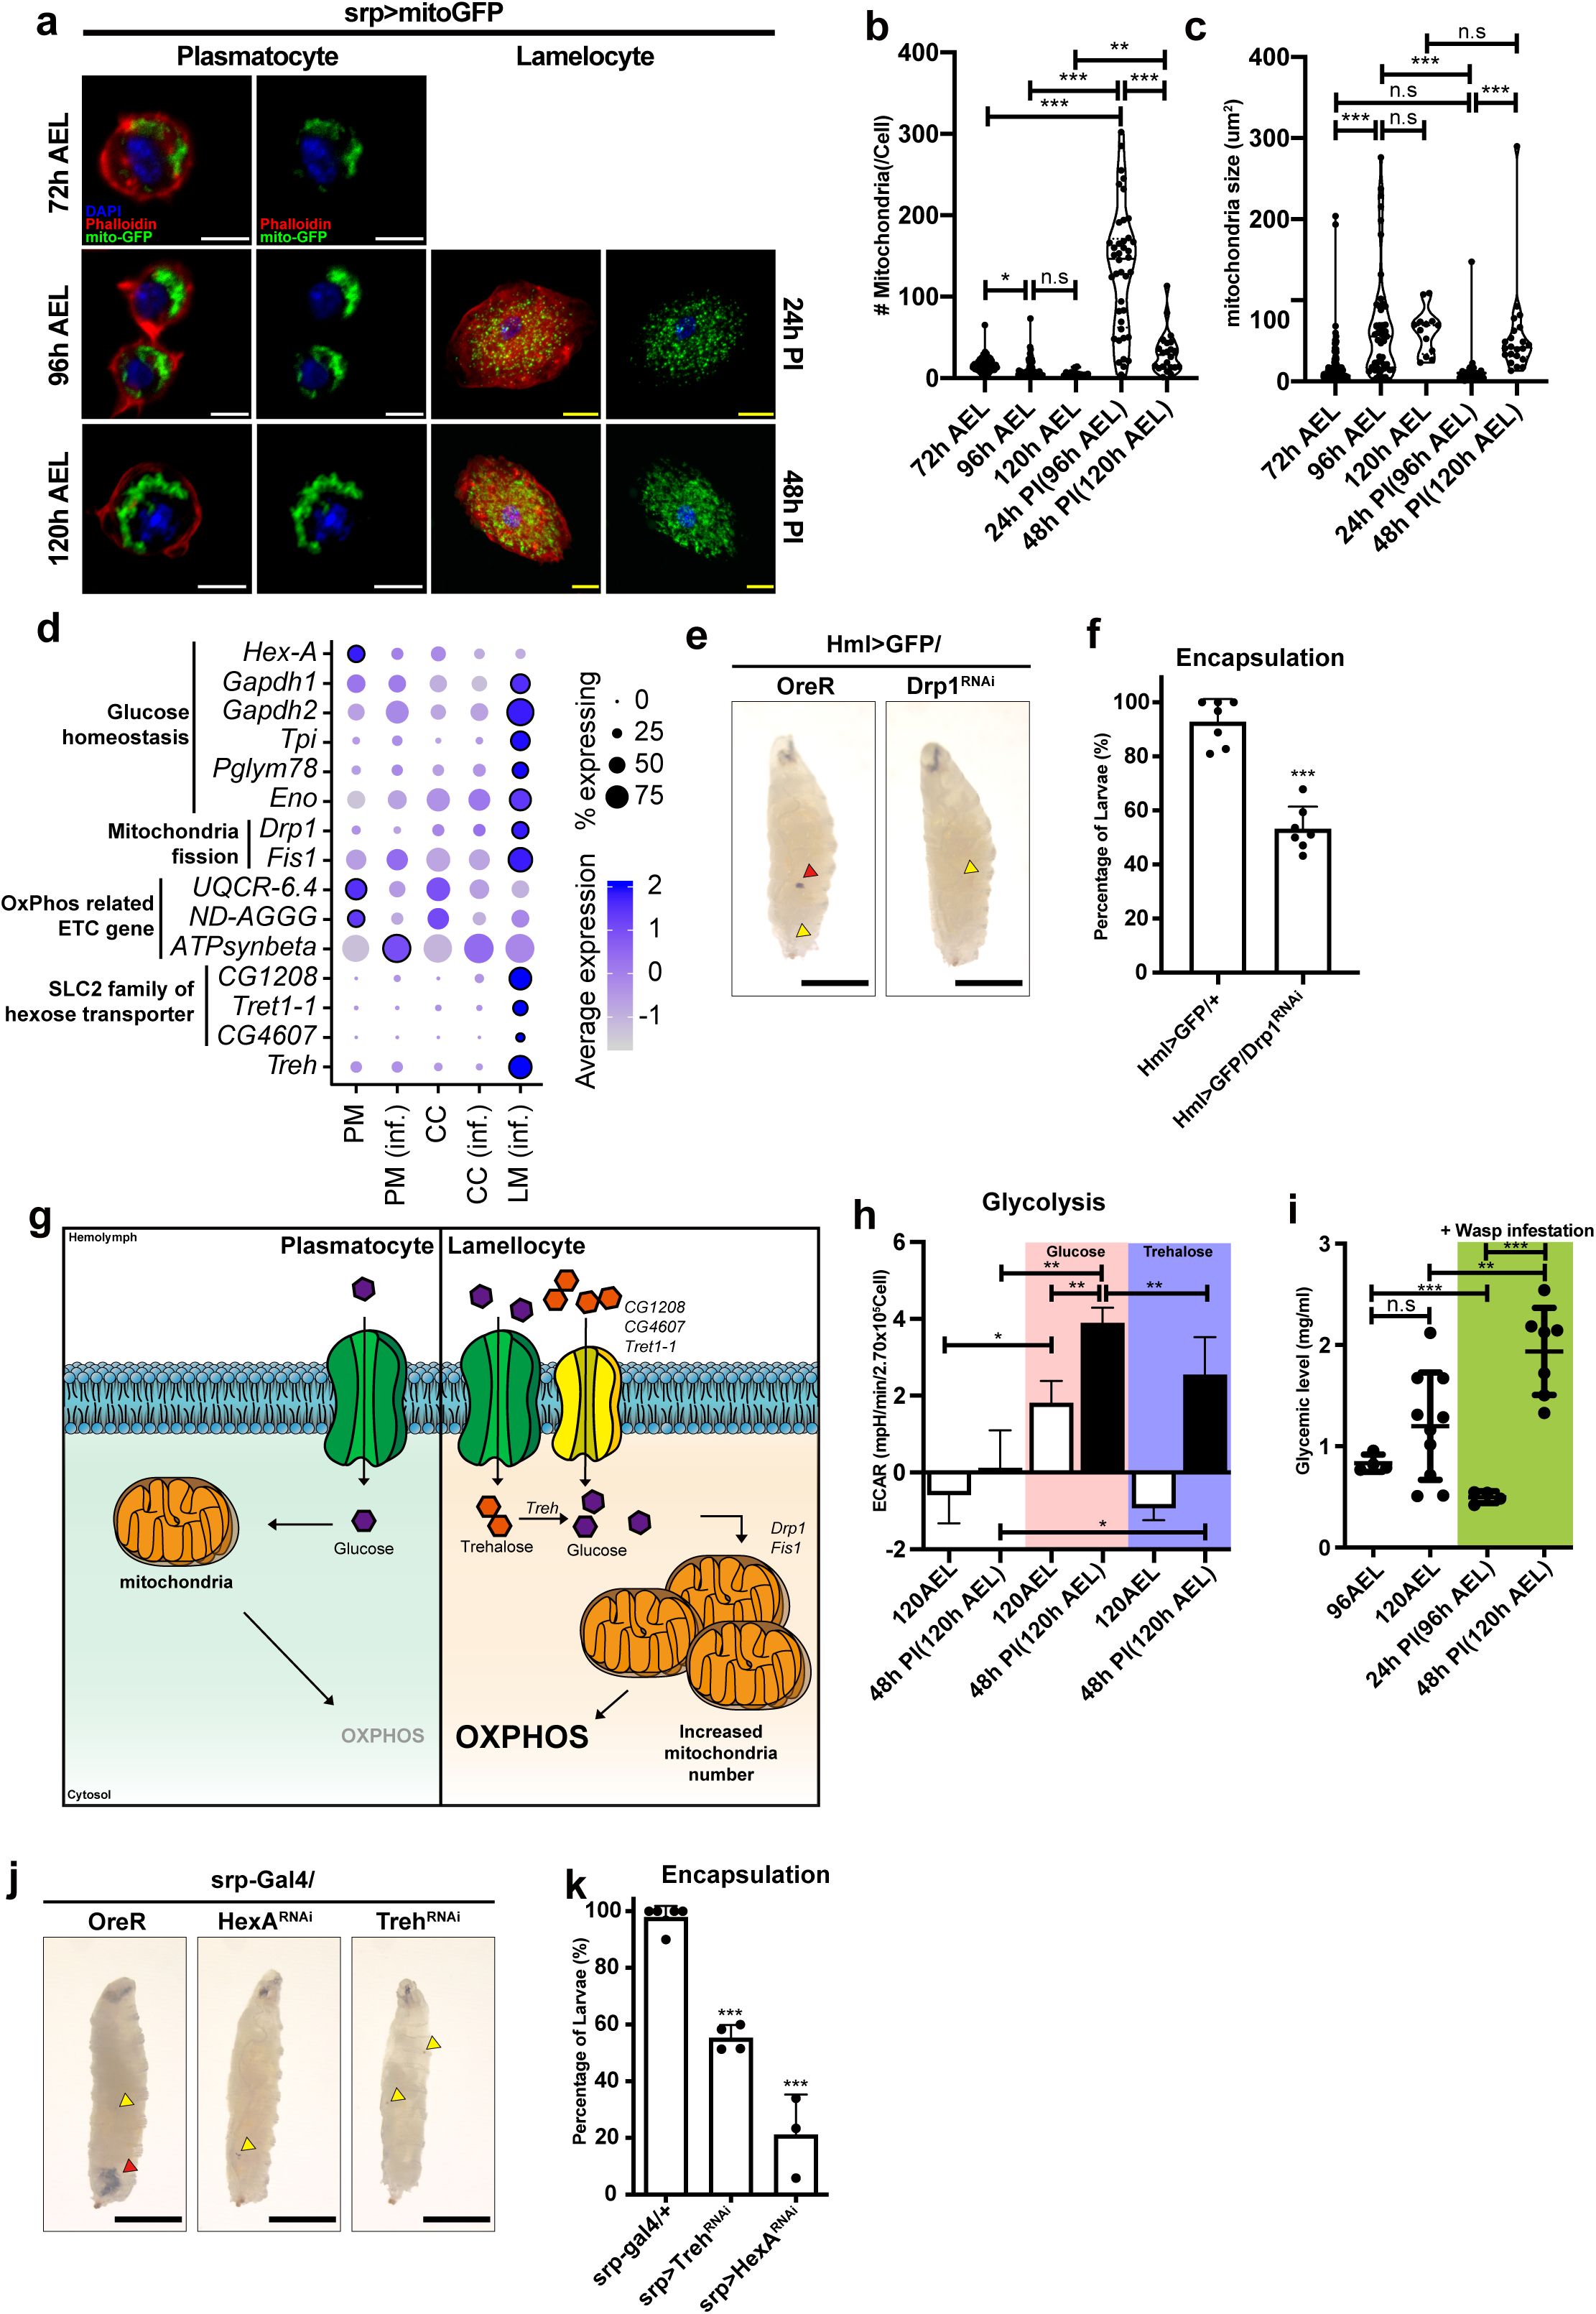
Mitochondrial modification in hemocytes upon wasp infestation
(a)
Mitochondria morphology of plasmatocytes or lamellocytes at different developmental time points and upon wasp infestation (
srp-Gal4 UAS-mito-GFP
). Larvae were infected by wasps at 72 h AEL; thus, no corresponding lamellocyte image at this timepoint. 96 h AEL corresponds to 24 h post-infection (PI). 120 h AEL, 48 h PI. Phalloidin, red; mito-GFP; green, DAPI, blue. Scale bar: 5 μm (white), 20 μm (yellow)
(b)
The number and
(c)
size of mitochondria per cell at different developmental time points or upon wasp infection conditions
(d)
Dot plot expression of significantly changed metabolic genes across cell clusters. PM: plasmatocytes under conventional conditions, PM (inf.): plasmatocytes under wasp infestation, CC: crystal cells under conventional conditions, CC (inf.): crystal cells under wasp infestation, LM (inf.): lamellocytes under wasp infestation. Dot size represents the percentage of cells expressing each gene. Dot color shows average expression levels of metabolic genes.
(e)
Encapsulation of wasp eggs in
Drosophila
larvae at 60 h post-infestation (60 h PI). Control larvae (
Hml
Δ
-Gal4, UAS-EGFP/+
) containing melanized wasp eggs (red arrowhead) (left). Hemocyte-specific
Drp1
RNAi (
Hml
Δ
-Gal4, UAS-EGF, Drp1 RNAi
) reduces the rate of wasp egg encapsulation (right). Yellow arrowhead marks the wasp ovipositor injection site. Scale bar: 1 mm (black)
(f)
Quantification of encapsulation rates shown in
(e)
. Each dot represents the encapsulation ratio from each trial (n=147, 230 respectively).
(g)
A schematic diagram correlating metabolic gene expressions, mitochondrial morphology, and metabolic modification in plasmatocytes and lamellocytes. After wasp infestation hemocytes differentiate into lamellocytes and increase the expression of sugar transporters (
CG1208, CG4607 and Tret1-1
) and trehalase (
Treh
) to enhance sugar uptake. In addition, lamellocytes increase both the number and size of mitochondria, leading to an increased capacity for oxidative phosphorylation (OXPHOS).
(h)
Quantification of ECAR following glucose or trehalose injection corresponding to
Supplementary Figure 5(b)
and
(c).
Pink shade indicates glucose-injected samples; purple indicates trehalose. Black bar denotes hemocytes upon 48 h post-infection (corresponding to 120 h AEL).
(i)
Glycemic levels of larval hemolymph at different developmental time points (96 h AEL and 120 h AEL) and infestation condition (24 h PI and 48 h PI). Green shading indicates wasp infested conditions.
(j)
Encapsulation of wasp eggs in
Drosophila
larvae at 60 h post-infestation (60 h PI). Wild-type larvae containing melanized wasp eggs (red arrowhead) (left). Hemocyte-specific
Hex-A
RNAi (
srp-Gal4 UAS-Treh RNAi
) or
Treh
RNAi (
srp-Gal4 UAS-Hex-A RNAi
) reduced the rate of wasp egg encapsulation (middle and right). Yellow arrowhead marks the wasp ovipositor injection site. Scale bar: 1 mm (black)
(k)
Quantification of encapsulation rates shown in
(h)
. Each dot represents the encapsulation ratio from 40 animals (n=200, 160, 120, respectively). In (
b)
, (
c)
, (
f), (h)
,
(i)
and (
k),
statistical analysis was performed using unpaired t-test. n.s: not significant (p > 0.05). *p < 0.05; **p < 0.01; ***p < 0.001. Bars in graphs: the mean. Error bars: standard deviation.
Mitochondrial fission is required for lamellocyte immune function
To understand how hemocytes acquire differential mitochondrial activity during development and immune activation, we examined transcriptional profiles of metabolic genes in wild-type and wasp-infested larval hemocytes extracted from the single-cell RNA sequencing
5
,
7
. We integrated single-cell RNA transcriptomes of hemocytes into pseudo-bulk levels and clustered cell types into six groups: developing plasmatocytes at 96 h AEL or 120h AEL, plasmatocytes upon wasp infestation at 24 h PI or 48 h PI, and lamellocytes at 24 h PI or 48 h PI, corresponding 96 h or 120 h AEL, respectively. Metabolic gene expressions in plasmatocytes at 96 h or 120 h AEL were nearly identical, except for a minor decrease in hexokinase,
Hex-A
(
Figure 4d
). However, plasmatocytes changed their metabolic gene expressions during wasp parasitism by downregulating
Hex
-
A
,
UQCR-6.4
(mitochondrial electron transport, complex III),
ND-AGGG
(mitochondrial electron transport, complex I), and up-regulating
Gapdh2
,
Cyt-c1
, or
ATPsynbeta
(
Figure 4d
). Lamellocytes at 24 h or 48 h PI, on the other hand, displayed considerably distinct metabolic gene expression profiles than plasmatocytes. Four representative categories of genes were highly induced in lamellocytes: glucose homeostasis (
Gapdh1
,
Gapdh2
,
Tpi
,
Pglym78
, and
Eno
), mitochondrial fission (
Drp1
and
Fis1
), SLC2 family sugar transporter (
CG1208
,
Tret1-1
, and
CG4607
), and starch and sucrose metabolism (
Treh
) (
Figure 4d
). These genes in lamellocytes were already elevated by 24 h PI and their expression further increased as lamellocytes mature by 48 h PI (
Figure 4d
). The elevation of mitochondrial fission genes such as
Drp1
and
Fis1
in the lamellocyte corresponded with the changes in mitochondrial morphologies (
Figure 4d
). However, we found no apparent changes in the mitochondrial fusion gene,
Marf
, in lamellocytes at these time points (
Supplementary Figure 5a
). To test whether mitochondrial fission is associated with lamellocyte differentiation or function, we analyzed lamellocyte numbers and encapsulation success rates after knocking-down
Drp1
in hemocytes (
Hml
Δ
-Gal4 UAS-GFP UAS-Drp1 RNAi
). Despite the marked upregulation in
Drp1
mRNA,
Drp1
RNAi did not alter lamellocyte differentiation (
Supplementary Figure 5a-b
). However, hemocyte-specific expression of
Drp1
RNAi significantly reduced encapsulation of wasp eggs (
Figure 4e-f
), suggesting that mitochondrial remodeling is required for melanization response mediated by lamellocytes. Together, these findings indicate that relative to both unchallenged and challenged plasmatocytes, lamellocytes emerging upon wasp infestation exhibit differential expression of genes associated with sugar metabolism and mitochondrial structure and activity. Additionally, morphological rearrangement of mitochondria is critical for immune effector function of lamellocytes (
Figure 4g
).
Functional lamellocytes utilize sugars to fuel mitochondrial respiration
Given that hemocytes at 48 h PI stimulate energy production and lamellocytes express increased levels of sugar metabolism and mitochondria-related genes, we investigated whether hemocytes at 48 h PI respond differently to sugars. Trehalose, a primary sugar type used by
Drosophila
, is either stored in the fat body or mobilized to glucose as an energy course
57
. To test if hemocytes under unchallenged conditions and immune-activated hemocytes differentially respond to sugars, we injected trehalose or glucose into control hemocytes at 120 h AEL or lamellocytes at 48 h PI. Hemocytes at 120 h AEL marginally elevated ECAR levels after glucose inoculation, which subsequently declined following oligomycin administration (
Figure 4h
;
Supplementary Figure 5c
). However, trehalose injection did not raise ECAR levels in control hemocytes, implying a specific response of developing hemocytes to glucose (
Figure 4h
;
Supplementary Figure 5c
). In contrast, hemocytes at 48 h PI, mainly comprised of lamellocytes, reacted to both glucose and trehalose injection by instantly increasing their ECAR levels, which were suppressed by oligomycin (
Figure 4h
;
Supplementary Figure 5d
). The significance of glycolysis in the ECAR elevation was probed by applying 2-DG to these hemocytes following the oligomycin treatment. 2-DG did not alter ECAR similarly to unchallenged controls (
Supplementary Figure 5c-d
). These data suggest that lamellocytes utilize glucose and trehalose mainly through mitochondrial respiration rather than activating glycolysis.
Innate immunity counteracts nutrient storage
58
,
59
and consequently changes the hemolymph sugar levels
39
,
60
,
61
. To understand how systemic sugar levels correlations with hemocyte metabolism, we measured hemolymph sugar levels before and after wasp infestation and across development. Between 96 to 120 h AEL, larvae showed a dramatic increase in glycemic levels that represent both trehalose and glucose in the hemolymph (
Figure 4i
). Similar to developing hemocytes, wasp infestation led to a robust increase in glycemic levels at 48 h PI, reaching levels higher than those observed in 120h AEL (
Figure 4i
). To test whether elevated glycemia and sugar responsiveness during wasp parasitization contribute to hemocyte differentiation or proliferation, we quantified total hemocytes, Pxn
+
plasmatocytes, and lamellocytes after hemocyte-specific RNAi against
HexA
or
Treh
RNAi (
Srp-Gal4 UAS-Treh RNAi
or
Srp-Gal4 UAS-HexA RNAi
). Knockdown of these sugar metabolism or transporter genes did not alter absolute hemocyte counts, including lamellocytes (
Supplementary Figure 6a-c
). However, it significantly reduced the efficiency of wasp egg encapsulation (
Figure 4j-k
), indicating that sugar metabolism is essential for the functionality of lamellocyte-mediated encapsulation, similar to the inhibition of mitochondrial fission (
Figure 4e-f
). Together, these results indicate that developing hemocytes are selectively responsive to glucose, whereas hemocytes stimulated during wasp parasitism (48h PI), which largely comprise lamellocytes, utilize both glucose and trehalose to support elevated metabolic activities. Furthermore, metabolic reprogramming, associated with mitochondrial remodeling and sugar responsiveness, is critical for the activation of innate immune function of lamellocytes.
Discussion
In this study, we characterized the metabolic characteristics of
Drosophila
larval hemocytes and identified that these cells primarily rely on oxidative phosphorylation (OXPHOS) for energy metabolism. We showed that OXPHOS activity scales linearly with hemocyte proliferation during development and in response to genetic perturbations, except crystal cells. Furthermore, lamellocyte differentiation induced either by the hemocyte-specific expression of
hop
TumL
or by parasitic wasp infestation significantly enhances both OXPHOS capacity and activity. This metabolic shift was accompanied by mitochondrial remodeling and the upregulation of trehalose metabolism-related genes. While trehalose metabolism was required for an effective melanization response, it did not significantly modify the differentiation of lamellocytes or the underlying OXPHOS-dependent respiration even during immune challenge. Collectively, our findings indicate OXPHOS-dependent respiration and its associated metabolic pathways are closely associated with hemocyte proliferation and innate immune activation, implying a distinctive metabolic strategy of myeloid-like immune cells in
Drosophila
.
Macrophages serve as sentinels of cellular stress and immune challenge, exhibiting remarkable plasticity in response to various environmental stimuli
62
. In vertebrates, activated macrophages are traditionally categorized into pro-inflammatory M1 and anti-inflammatory M2 phenotypes, which display profound metabolic divergence. M1 macrophages preferentially utilize aerobic glycolysis and the pentose phosphate pathway (PPP) to support rapid energy production and the biosynthesis of inflammatory intermediates
63
,
64
, whereas M2 macrophages rely on OXPHOS
65
. In this context, our results demonstrate that
Drosophila
hemocytes, mainly consisting of macrophage-like plasmatocytes, show a metabolic signature similar to that of M2 macrophages, characterized by a high dependence on OXPHOS-driven metabolism. Interestingly, and in contrast to the vertebrate M1 paradigm,
Drosophila
hemocytes do not undergo a significant glycolytic shift even under immune challenge. Instead, they elevate total ATP production by the upregulation of OXPHOS capacity. By maintaining OXPHOS, hemocytes may be able to achieve the high metabolic efficiency required to support cellular remodeling of lamellocytes and support the synthesis of immune effectors for the melanization cascade. Alternatively, hemocytes may engage glycolysis transiently to mount a rapid response to acute infection and then revert to OXPHOS during the post-acute phase. This program may further support immune functions by directing carbon flux into the PPP pathway to maintain redox homeostasis
66
. Our data suggest the possibility that insect immune cells favor metabolic economy over the metabolic wastefulness of the Warburg effect. This strategy may be advantageous in the open hemolymph system where circulating sugar supports both systemic growth and immunity as a shared limiting source. Thus, immune activation may not universally require a glycolytic shift but may instead depend on the organism’s life traits and systemic metabolic preference.
Previous studies have shown that larval hemocytes are metabolically quiescent at steady-state, unchallenged conditions. However, sensory neurons triggered by wasp odors enhance GABA release to mount an immune response via lamellocyte differentiation
67
. The same pathway also modulates the ROS levels through succinate conversion
68
, which all contribute to metabolic activities. These studies indicate that TCA cycle may not be fully active in hemocytes under unchallenged conditions, which likely attenuates TCA cycle during the surveillance phase and constrains baseline metabolic activity of hemocytes. This strategy may be important for minimizing the systemic energy cost of maintaining a large immune cell population. Interestingly, this hypothesis is also consistent with studies demonstrating that a high sugar diet is detrimental to the development and immunity of larval hemocytes
51
,
69
. These collective findings, together with our analyses, support a hypothesis that larval hemocytes maintain a tightly regulated metabolic baseline that prioritize energy conservation during homeostasis while preserving sufficient bioenergetic plasticity for rapid metabolic reprogramming upon pathogen encounter.
In the late third instar, plasmatocytes comprise ∼ 95 % of hemocytes. Accordingly, our measurements primarily reflect the metabolic dynamics of plasmatocyte population. Despite efforts to profile each hemocyte type in isolation, it was not feasible to completely separate the three lineages. Instead, we leveraged genetic backgrounds that bias expansion of specific hemocyte types, including
Hop
TumL
,
Ras
V12
, and
Notch
ICD
, to enrich for the population of interest. Expression of
Ras
V12
robustly expanded plasmatocytes by 10 to 50 folds with minimal lamellocyte expansion, whereas
Hop
TumL
or wasp infestation enabled metabolic quantification of lamellocytes alongside activated plasmatocytes
16
,
24
.
Notch
ICD
expression increased crystal cell differentiation but likely included a residual plasmatocyte fraction
13
. These enrichment strategies, while informative, introduce activation-state and admixture caveats that can influence metabolic readouts. Future cell-type resolved approaches, including advanced cell-sorting or single-cell metabolomic profiling, will be essential to define these programs and the underlying regulatory mechanisms across fully resolved hemocyte types and hematopoietic origins. Moreover, incorporating single-cell resolution analysis and space- and time-resolved measurements after immune or genetic perturbation will further clarify whether observed shifts reflect intrinsic metabolic rewiring or context-dependent activation.
While plasmatocytes in the unchallenged state express basal levels of carbohydrate transporters, lamellocytes significantly induced trehalose transporters and trehalase upon differentiation
5
–
7
. In addition, an elegant
13
C-isotope labeling approach showed that activated hemocytes channel carbon sources primarily into the cyclic pentose phosphate pathway (cyclic PPP) to generate NADPH, together with ATP, pyruvate, or pentose
66
. Integrating the prior work with our analyses, we propose that activated plasmatocytes and lamellocytes maximize cyclic PPP flux to bolster antioxidant buffering for host protection, while sustaining viability via OXPHOS-mediated energy metabolism. By contrast, increasing the number of crystal cells did not significantly alter overall metabolic parameters. Although crystal cells were viable at the time of measurement, they may have adjusted their metabolic program in response to environmental changes
in vitro
. Moreover,
N
ICD
-induced crystal cells may not fully recapitulate developmentally programmed crystal cell differentiation and maturation. Given that crystal cells are non-mitotic and expand by transdifferentiation
70
and that crystal cells express a significant number of oxygen-carrying proteins
14
, these cells may adopt a distinct metabolic strategy relative to lamellocytes or plasmatocytes.
Materials and methods
Drosophila
melanogaster stocks and genetics
The following
Drosophila
stocks were used in this study:
Hml
Δ
-Gal4
(S.Sinenko),
UAS-Ras
V12
(BL4847),
UAS-hid, rpr
(Nambu J. R.),
UAS-hop
Tum-l
(K.Brueckner),
Srp-Gal4
(L.Waltzer),
UAS-mito-HA-GFP
(BL8442),
Drp1 RNAi
(BL27682),
Hex-A RNAi
(BL35155),
Treh RNAi
(BL51810),
UAS-Notch
ICD
(U. Banerjee).
Fly stocks used in this study were maintained at 18 °C. Unless otherwise indicated, Gal4-UAS fly crosses were incubated at 25 °C and 70 % humidity. To synchronize larval development, approximately one hundred adult flies were allowed to lay eggs on a grape-juice agar plate for two-hour period. At 23 hours after egg laying (AEL), any hatched larvae were eliminated from the plate. Larvae were then transferred to and maintained on standard cornmeal-based food at 24 h AEL.
Hemocyte isolation and immunohistochemistry
Before hemocyte isolation, larvae were vortexed with glass beads (Sigma-Aldrich, G9268) for three minutes. This step was performed to extract total hemocytes, including sessile and circulating populations. Vortexed larvae were bled onto a slide glass (Immuno-Cell Int, 61.100.17) which was kept at 4 °C (or on ice) for 45 minutes to allow hemocytes to settle and adhere. Samples were fixed with 3.7 % formaldehyde in 1x PBS for 30 minutes. Following fixation, samples were washed three times in 0.4 % Triton X-100 in 1× PBS for 10 minutes and blocked in 10 % normal goat serum (NGS) in 0.4 % TritonX, 1× PBS for 30 minutes. The primary antibody (α-Pxn, 1:2000) was added and samples were incubated in a humidified chamber overnight at 4 °C. The following day, samples were washed three times in 0.4 % Triton X in 1× PBS and incubated in the secondary antibody or Phalloidin (ThermoFisher, A12380, 1:400) for 3 hours at room temperature
71
. After washing 3 times with 0.4% Triton X in 1× PBS, samples were mounted using Vectashield (Vector Laboratory) with DAPI and imaged using the Zeiss Axio Imager M2, Nikon C2 Si-plus, or Zeiss LSM900 with Airyscan confocal microscope. Images were analyzed by Image J (Version 1.54) or Imaris (Bitplane).
Analysis of
D. melanogaster
samples using the Agilent Seahorse XFe96 analyzer
The Agilent Seahorse XFe96 analyzer was preset and maintained at 28 °C (heater on). The day prior to the analysis, the Agilent Seahorse XFe96 cartridge (Agilent, 102416-100) was hydrated using a utility plate (Agilent, 102416-100) filled with 200 μl of cell culture grade sterile water and incubate in a 28 °C non-CO
2
chamber. Simultaneously, the Seahorse XF calibrant buffer (Agilent, 102416-100) was pre-warmed in 28 °C non-CO
2
chamber. The following day, water was removed from both the utility plate and the cartridge. The utility plate was refilled with 200 μl of pre-warmed calibrant buffer in each well. The cartridge was combined with utility plate and incubated in the 28 °C non-CO
2
chamber over 30 minutes before running the analyzer. Larval brain was dissected in phosphate-buffered saline (PBS) and loaded onto the Agilent Seahorse XF96 cell culture microplates (101085-004) containing assay media. The brains were carefully settled to the bottom center of each well in the microplate. To ensure optimal signal, we recommend to gently put the brain to the center of the well between the three spherical supports using a pipet tip.
Hemocytes and S2 cells were prepared in Schneider’s
Drosophila
Medium (Thermo Fisher, 21720024) and filtered using a 40 μm cell strainer (Falcon, 352340). Filtered cells were centrifuged at 6000 rpm for 5 minutes and suspended into the assay media. After adjusting the cell concentration to 1.5x10
6
cells/ml, 180 μl of the assay media was added to each well.
The sample-loaded microplate was centrifuged at 3000 rpm for 3 minutes (Eppendorf, EP022628146) to ensure settling and adherence. The cartridge combined with utility plate was loaded with assay solution on injection ports and placed onto the Seahorse XFe96 analyzer and the run was initiated. The utility plate was replaced with the sample microplate after the equilibration phase.
Assay media and solutions
Assay media were prepared immediately prior to each experiment based on the specific metabolic test. The base media for all assays were Seahorse XF DMEM medium, pH 7.4 (Agilent, 103575-100). For real-time ATP rate assay, glycolytic rate assay, and mito stress test, the base medium was supplemented with 10 mM of XF glucose (103577-100), 1mM of XF pyruvate (103578-100), and 2mM of XF glutamine (103579-100). For glycolysis stress test, the assay was proceeded in Seahorse XF DMEM medium, pH 7.4 mixed with 2mM of XF glutamine (103579-100).
Metabolic inhibitors or substrates were prepared as 10X stock solutions and diluted into the respective basal assay media: Oligomycin A (Sigma-Aldrich, O4876), 2-DG (Sigma-Aldrich, D8375), Rotenone (Sigma-Aldrich, R8875), FCCP (Sigma-Aldrich, C2920), glucose (103577-100), or trehalose (PHR1344). These media were loaded into the Seahorse XFe96 analyzer injection ports immediately before the assay run.
Wasp infestation
Drosophila melanogaster
larvae were collected at 72h AEL and exposed to
Leptopilina boulardi
(G486) wasps for 6 hours. Following the exposure, adult wasps were removed. The infestation process was maintained under controlled conditions of 25 °C and 70 % humidity. Infestation was confirmed by observation of wasp eggs or larvae inside the host, which was verified during bleeding.
Preprocess of scRNA-seq datasets
Drop-seq UMI count matrices of circulating hemocytes from 96 and 120 h AEL under steady state and wasp infection were retrieved from our previous study GSE141273
7
. Total of 12 libraries, three for each condition, were downloaded and merged. Because the gene annotation version was different between steady state (BDGP 6.22) and wasp infested (BDGP 6.02) data, an FBgn to Annotation ID conversion table from FlyBase (
; fbgn_annotation_ID_fb_2019_03.tsv) was used to convert gene IDs to the BDGP 6.22 version. Because these UMI matrices were already preprocessed (i.e., filtration of low-quality cells based on UMI, gene counts, and mitochondrial contents), no further filtration was performed. Briefly, a few outlier cells were first filtered using UMI thresholds; 96 and 120 h AEL wild type, UMI count > 50,000; 96 h AEL infested, > 70,000; 120 h AEL infested, > 55000. Then cells having UMI counts higher than two standard deviations from the mean UMI count were also removed to exclude possible multiplets. Low quality cells having only limited number of genes were also removed; 96 and 120 h AEL wild type, gene count < 200; 96 h AEL infested, < 300; 120 h AEL infested, < 400. Because mitochondrial contents in circulating hemocytes were a bit higher than those in lymph gland counterparts (a threshold of < 10% was used), we applied 20% as a threshold. Remaining cells were 1006 (96 h AEL wild type), 1671 (120 h AEL wild type), 5986 (96 h AEL infested), and 6693 cells (120 h AEL infested).
Integration of scRNA-seq data from different conditions
For each dataset (96 h AEL steady state, 96 h AEL wasp infested, etc.), libraries were first predicted for cell types using a lymph gland from 72 to 120 h AEL as a reference as we performed in the previous study
7
. In details, each dataset was first transformed to a Seurat object and three independent sequencing libraries were integrated using FindIntegrationAnchors() and IntegrateData() with default parameters
72
. Then, cell type annotation was transferred from the lymph gland dataset using FindTransferAnchors() and TransferData() with default parameters. Non-hematopoietic cell types (dorsal vessel, neurons, ring gland, and posterior signaling center cells) and a few minor subclusters (< 0.1% of total population) were removed. In the end, 995 (96 h AEL steady state), 1356 (120 h AEL steady state), 5674 (96 h AEL wasp infested), 6376 cells (120 h AEL wasp infested) were remained. After the prediction step, UMI counts were normalized, log-transformed, and scaled, and PCA analysis was performed which identified 40 significant principal components (PCs). Four datasets were integrated using Harmony
73
with default parameters. t-SNE and UMAP plots were generated using the selected numbers of PCs.
Supplementary figrues
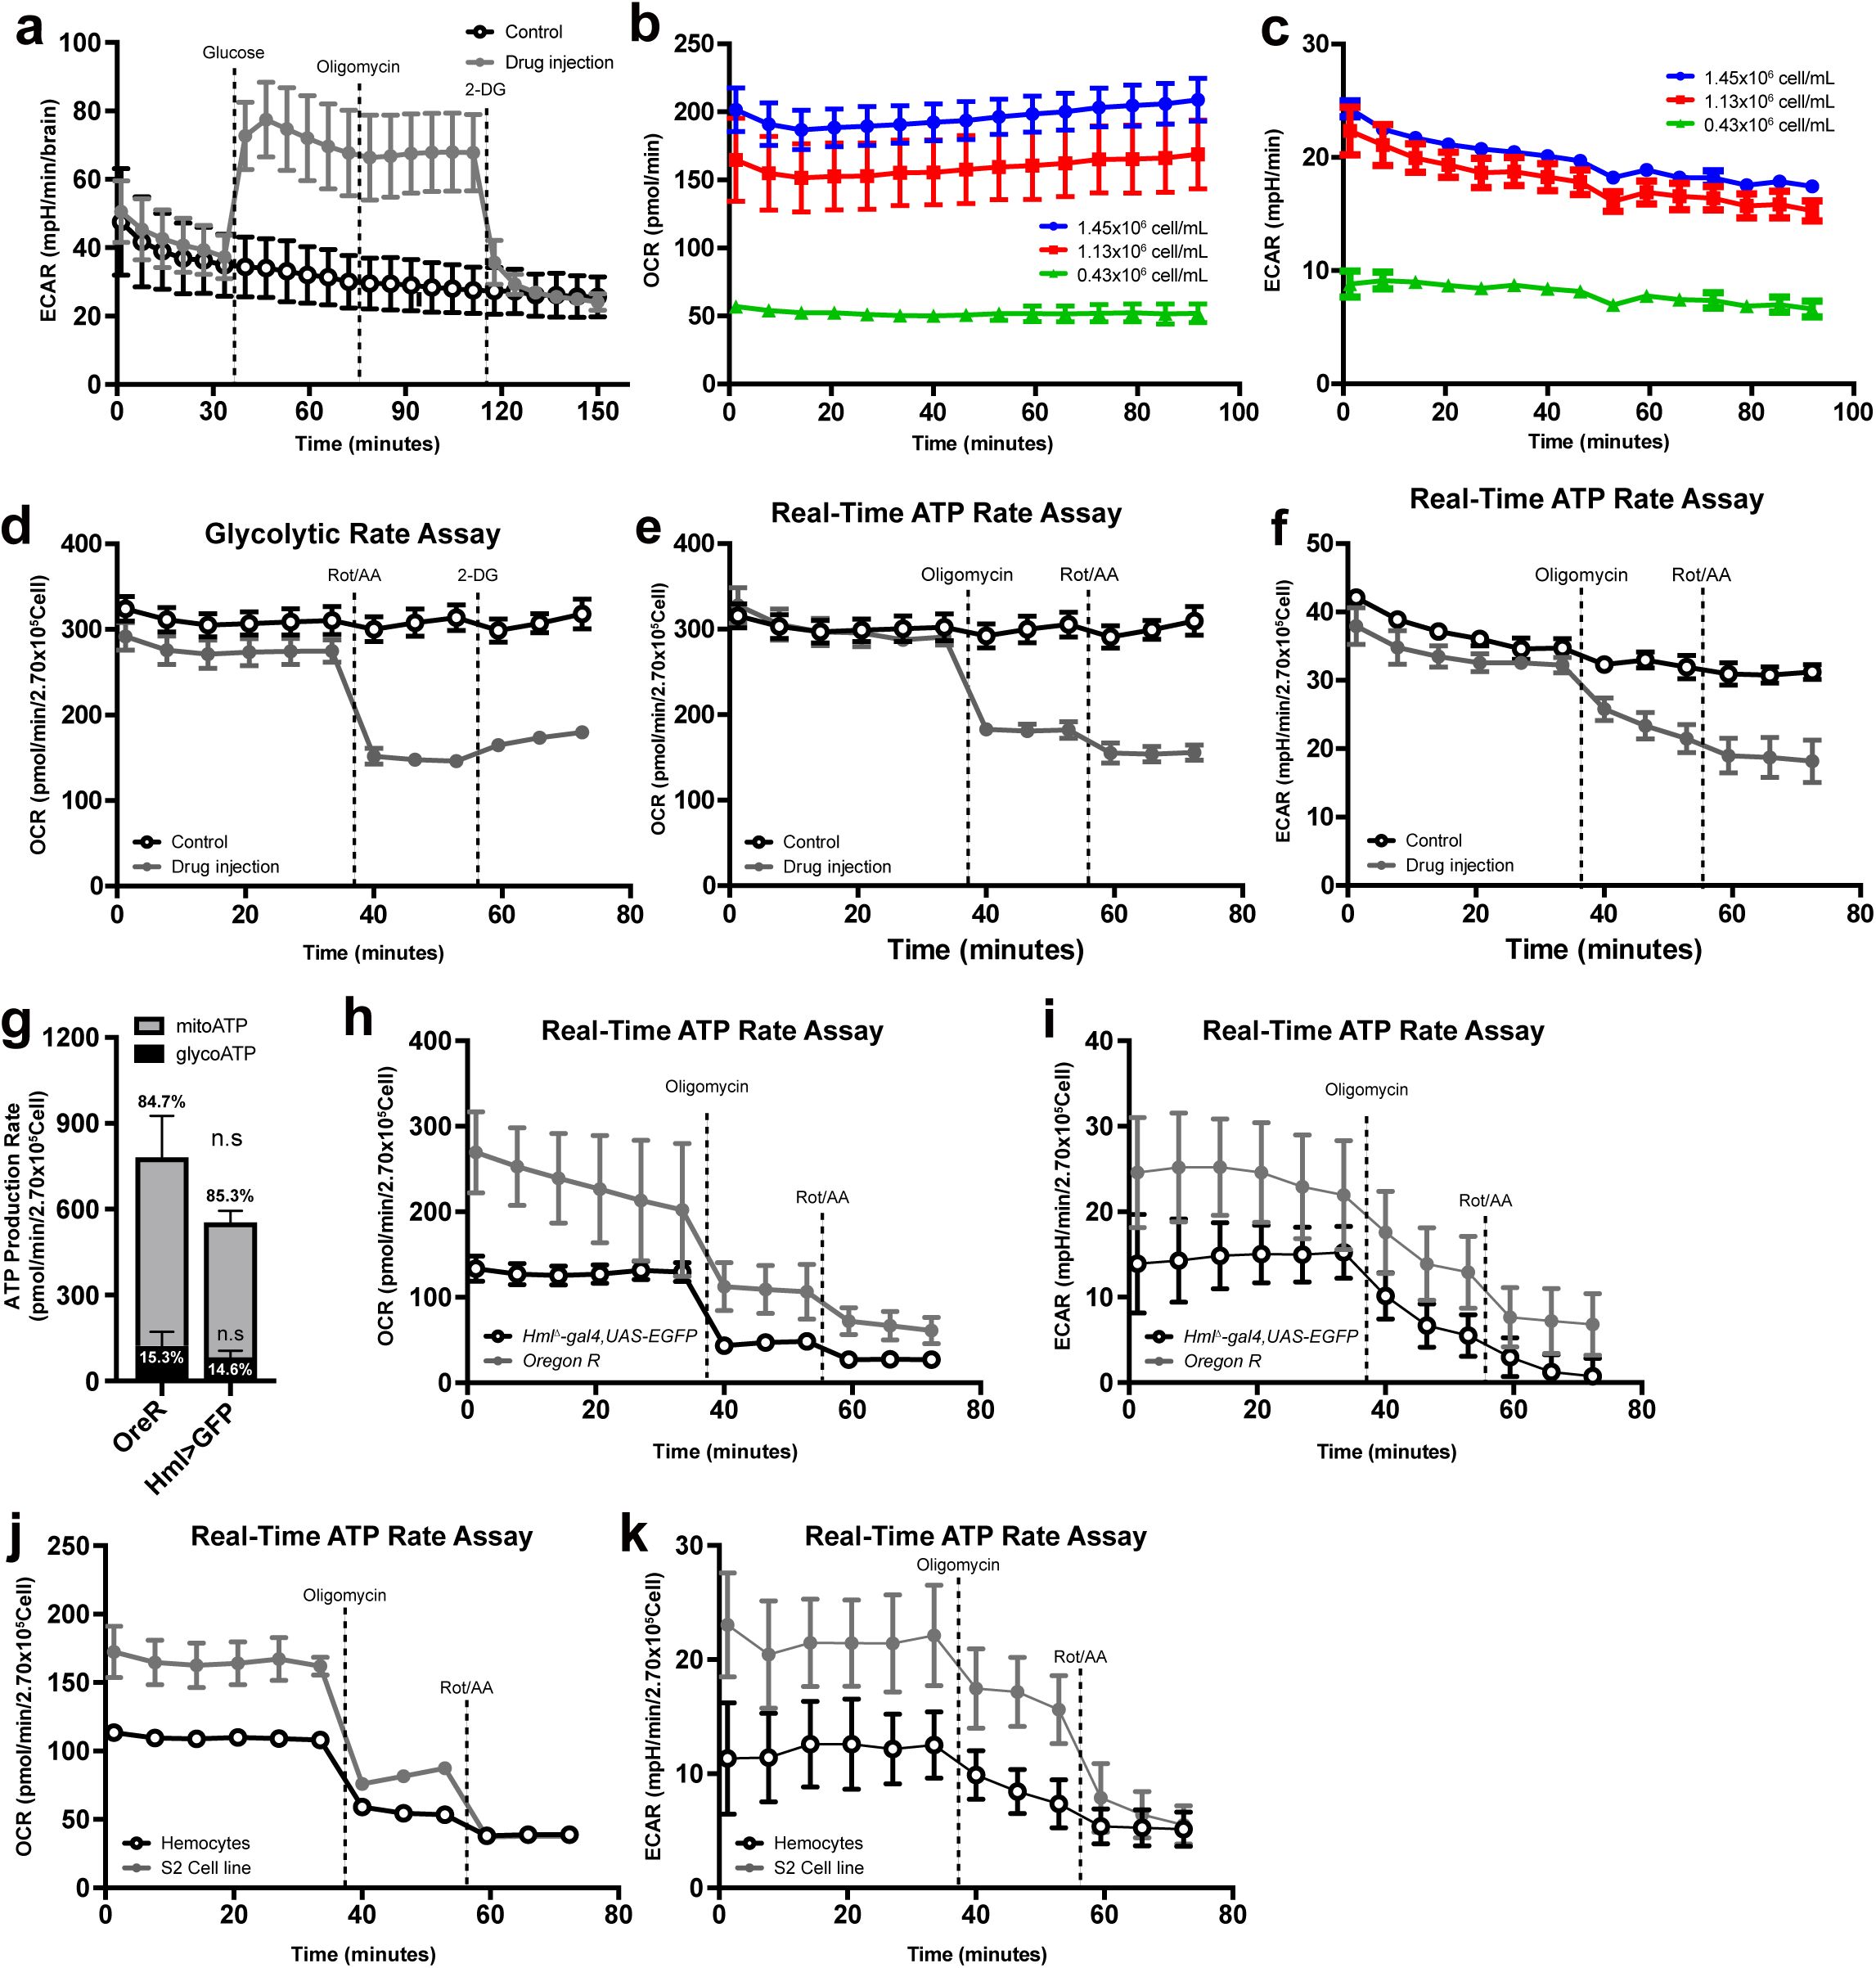
Seahorse XF assays using embryonically derived hemocytes.
(a)
Glycolysis stress test of
Drosophila
larval brain. Glucose, oligomycin, or 2-DG was injected after the 6th, 9th, or 12th measurement, respectively (gray). Controls (black) received assay medium only at volumes matched to glucose, oligomycin, or 2-DG injections.
(b)
Basal OCR levels of embryonically derived hemocytes (
Hml
Δ
-Gal4, UAS-EGFP
) with different cell density (0.43 x 10⁶ cells/ml, green; 1.13 x 10
6
cells/ml, red; 1.45 x 10
6
cells/ml, blue). Measurement was performed up to 15 cycles (90 minutes).
(c)
Basal ECAR levels of embryonically derived hemocytes (
Hml
Δ
-Gal4, UAS-EGFP
) with different cell density (0.43 x 10
6
cells/ml, green; 1.13 x 10
6
cells/ml, red; 1.45 x 10
6
cells/ml, blue). Measurement was performed up to 15 cycles (90 minutes).
(d)
Glycolytic rate assay (OCR) using embryonically derived hemocytes (
Hml
Δ
-Gal4, UAS-EGFP
). Rot/AA complex was injected after the 6th cycle and 2-deoxy-glucose (2-DG), after the 9th cycle (gray). Controls (black) received assay medium only at volumes matched.
(e)
Real-time ATP rate assay (OCR) using embryonically derived hemocytes (
Hml
Δ
-Gal4, UAS-EGFP
). Oligomycin was injected after the 6th cycle and Rot/AA, after the 9th cycle (gray). Controls (black) received assay medium only at volumes matched.
(f)
Real-time ATP rate assay (ECAR) using embryonically derived hemocytes (
Hml
Δ
-Gal4, UAS-EGFP
). Oligomycin was injected after the 6th cycle and Rot/AA, after the 9th cycle (gray). Controls (black) received assay medium only at volumes matched.
(g)
ATP production rate of hemocytes from two genetic backgrounds,
Oregon R
(
OreR
) and
Hml
Δ
-Gal4 UAS-EGFP
.
OreR
displays 15.3 % glycoATP and 84.7 % mitoATP.
Hml
Δ
-Gal4 UAS-EGFP
shows 14.6 % glycoATP and 85.3% mitoATP.
(h)
Real-time ATP rate assay (OCR) using hemocytes from
OreR
(gray) or
Hml
Δ
-Gal4 UAS-EGFP
(black). Oligomycin was injected after the 6th cycle and Rot/AA, after the 9th cycle.
(i)
Real-time ATP rate assay (ECAR) using hemocytes from
OreR
(gray) or
Hml
Δ
-Gal4 UAS-EGFP
(black). Oligomycin was injected after the 6th cycle and Rot/AA, after the 9th cycle.
(j)
Real-time ATP rate assay (OCR) using hemocytes (
Hml
Δ
-Gal4 UAS-EGFP
; black) or S2 cells (gray). Oligomycin was injected after the 6th cycle and Rot/AA, after the 9th cycle.
(k)
Real-time ATP rate assay (ECAR) using hemocytes (
Hml
Δ
-Gal4 UAS-EGFP
; black) or S2 cells (gray). Oligomycin was injected after the 6th cycle and Rot/AA, after the 9th cycle. In
(g)
, statistical analysis was performed using unpaired t-test. n.s: not significant (p > 0.05). *p < 0.05; **p < 0.01; ***p < 0.001. Bars in graphs: the mean. Error bars: standard deviation.
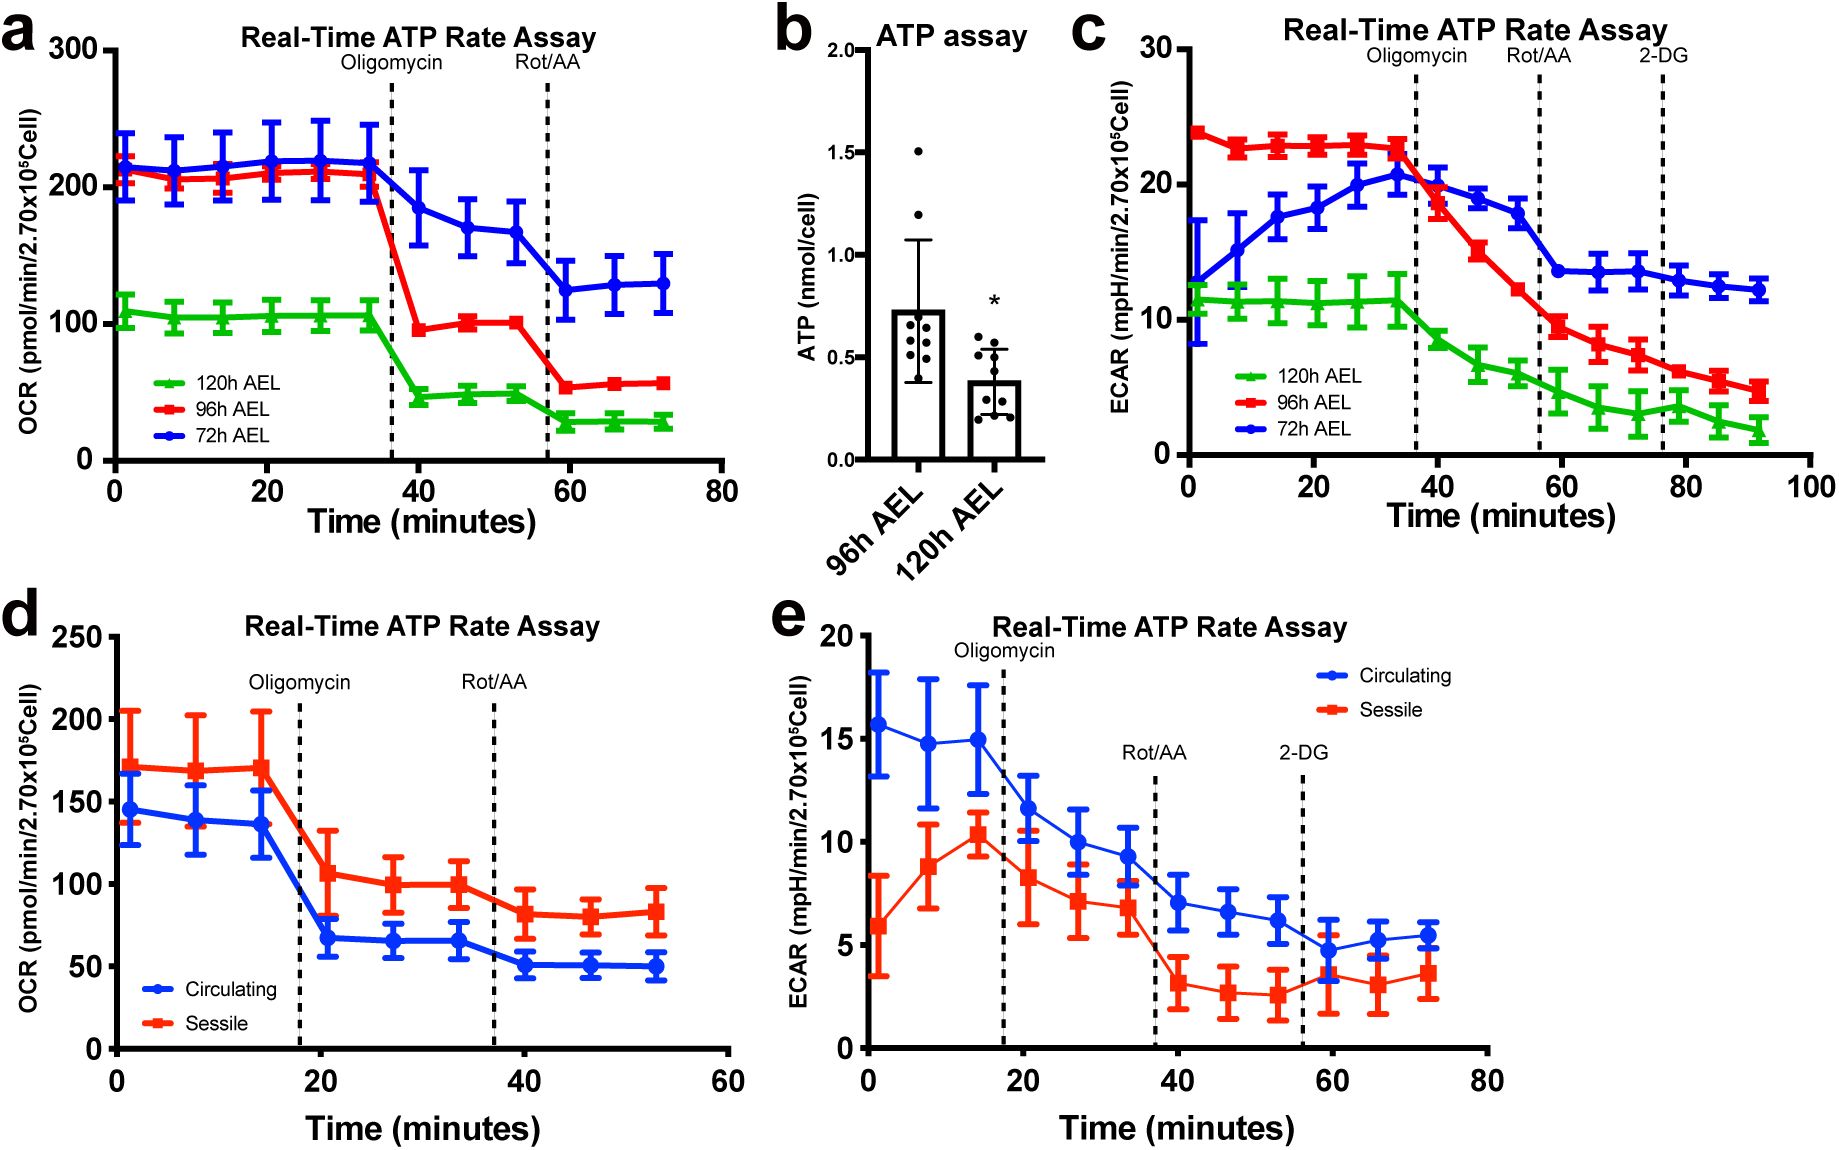
Real-time ATP rate assay using
Drosophila
larval hemocytes.
(a)
Real-time ATP rate assay (OCR) using hemocytes at 72 h (blue), 96 h (red), or 120 h (green) AEL. Oligomycin was injected after the 6th cycle and Rot/AA, after the 9th cycle.
(b)
ATP levels of
Drosophila
hemocytes at 96 h (left) or 120 h AEL (right). It was unfeasible to measure ATP levels of hemocytes at 72 h AEL.
(c)
Real-time ATP rate assay (ECAR) using hemocytes at 72 h (blue), 96 h (red), or 120 h (green) AEL. Oligomycin was injected after the 6th cycle and Rot/AA, after the 9th cycle.
(d)
Real-time ATP rate assay (OCR) using larval circulating (blue) or sessile (red) hemocytes. Oligomycin was injected after 6th cycle and Rot/AA, after 9th cycle.
(e)
Real-time ATP rate assay (ECAR) using larval circulating (blue) or sessile (red) hemocytes. Oligomycin was injected after 6th cycle; Rot/AA, after 9th cycle; and 2-DG, after 12th cycle. In
(b)
, statistical analysis was performed using unpaired t-test. n.s: not significant (p > 0.05). *p < 0.05; **p < 0.01; ***p < 0.001. Bars in graphs: the mean. Error bars: standard deviation.
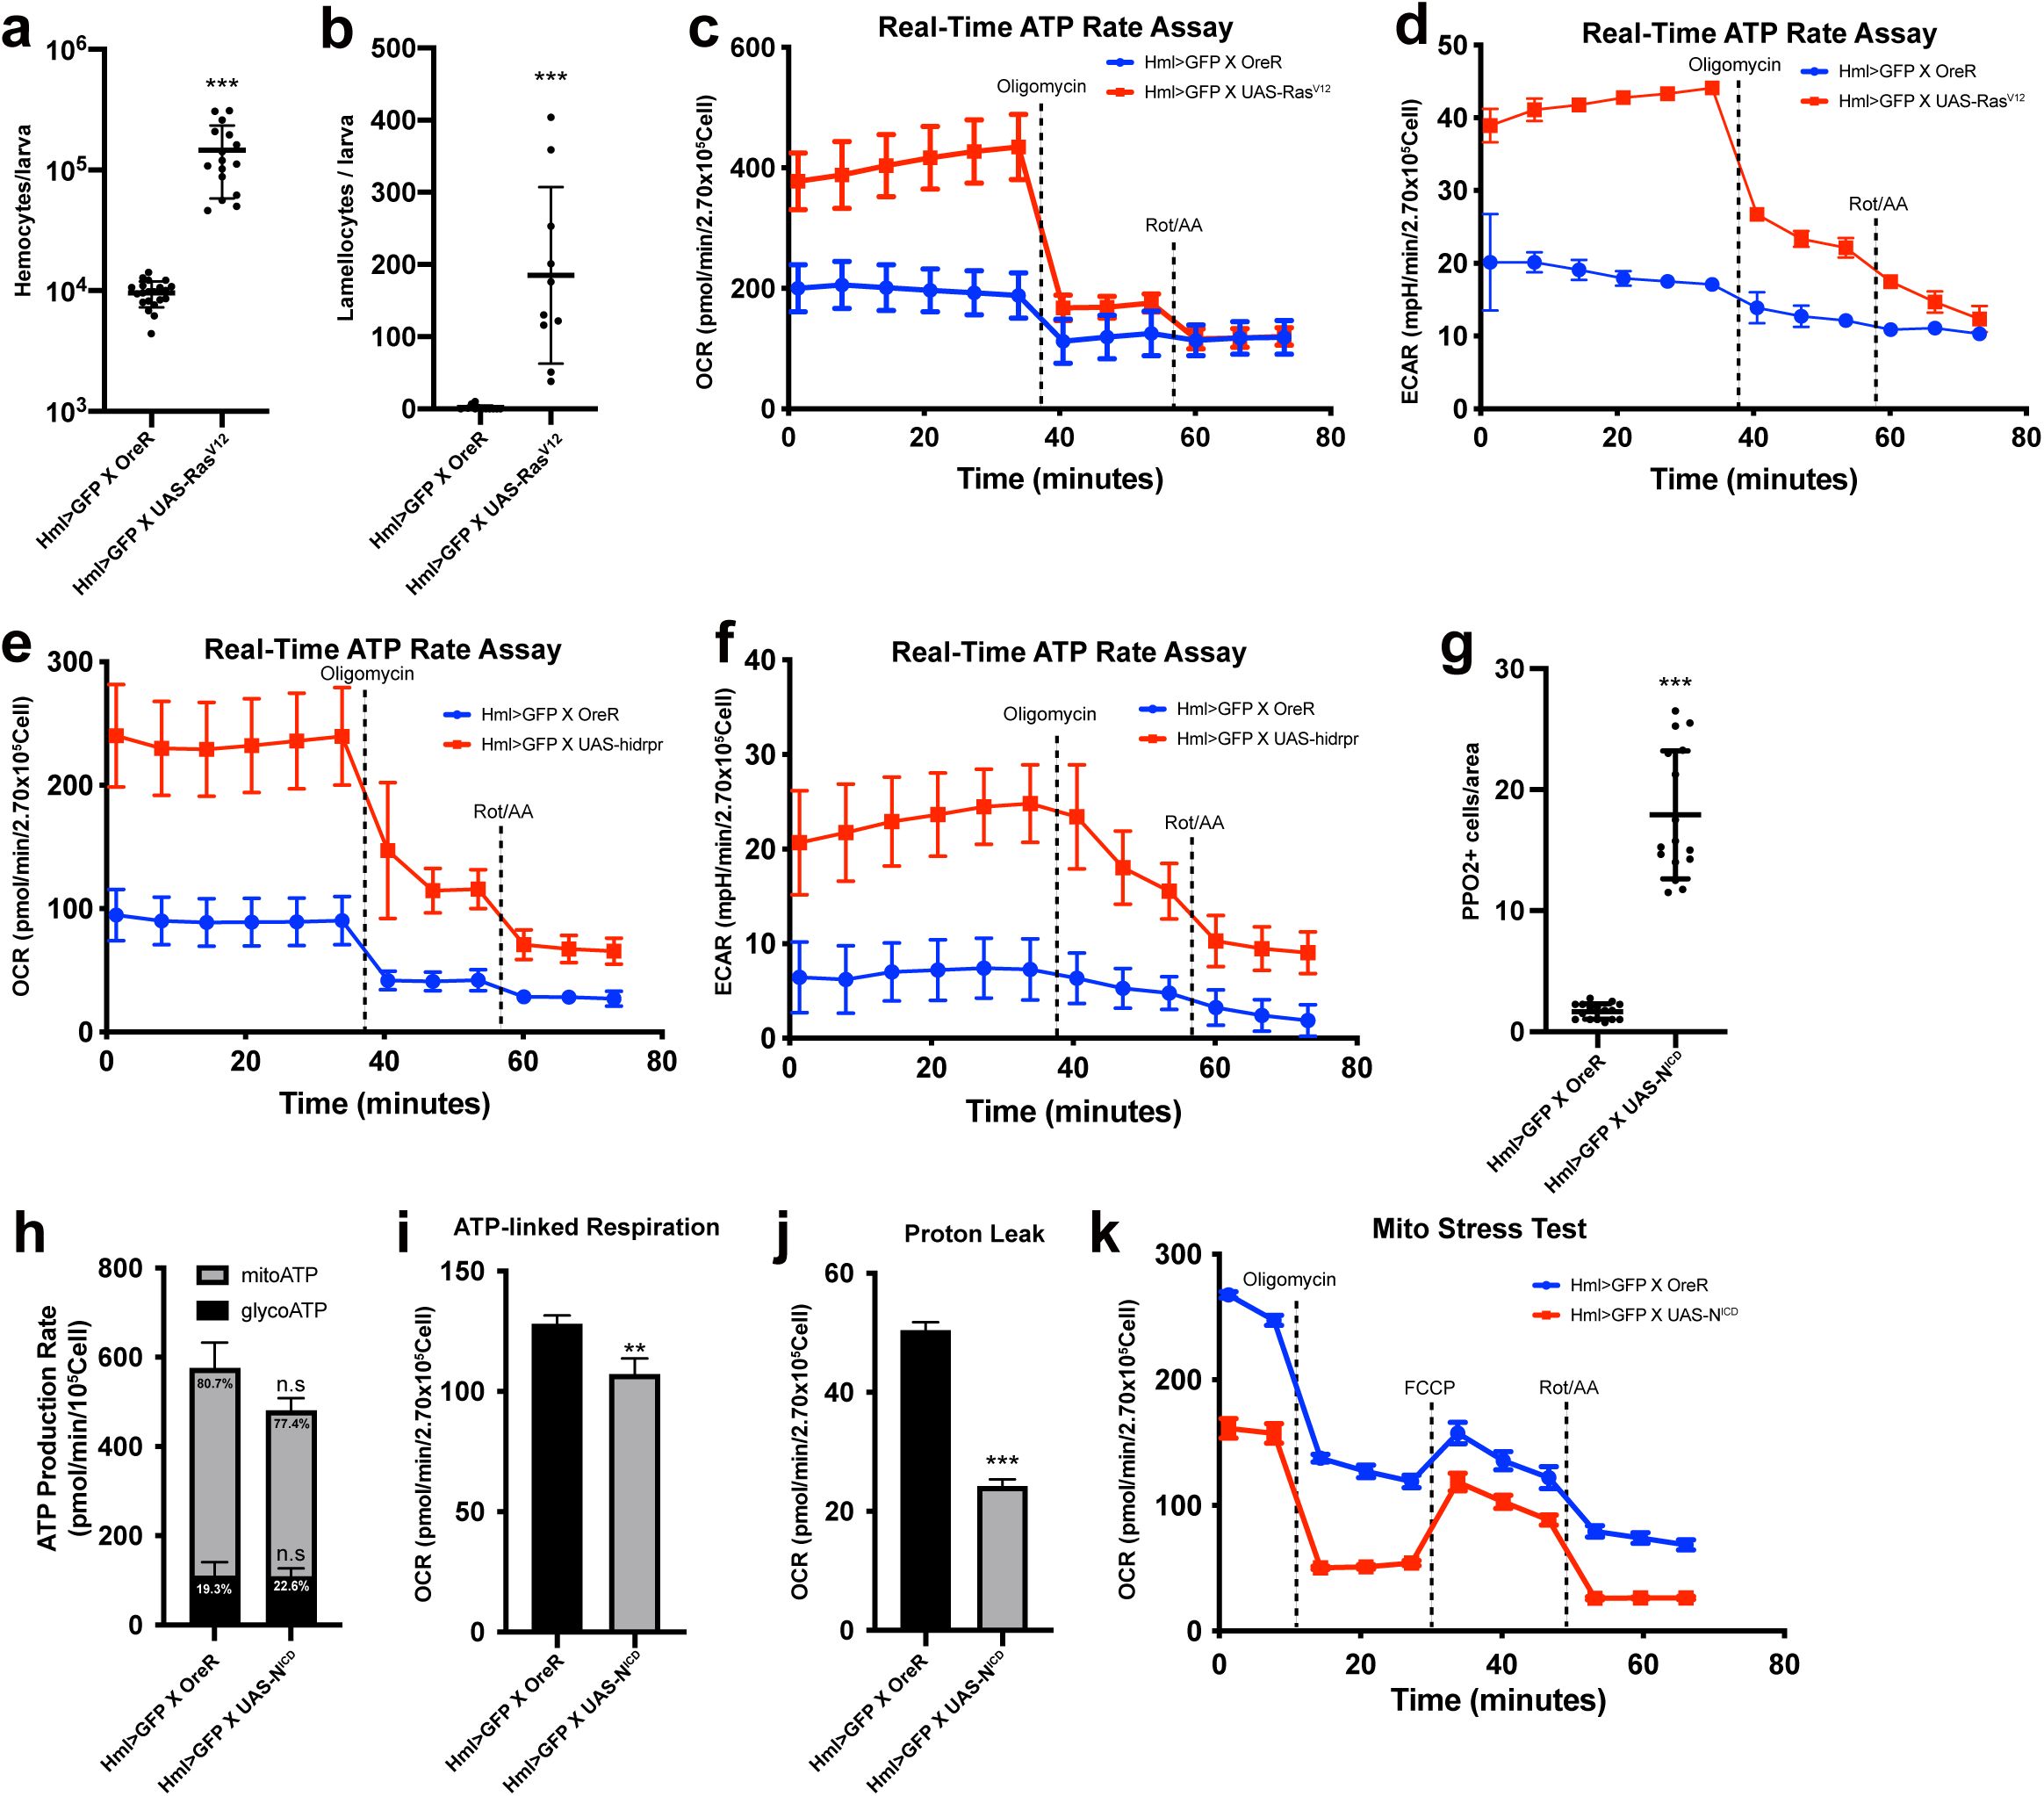
Metabolic measurement of larval hemocytes from different genetic backgrounds
(a)
Quantification of the number of total hemocytes per one larva in each genotype.
Hml
Δ
-Gal4, UAS-EGFP/+
and
Hml
Δ
-Gal4, UAS-EGFP; UAS-Ras
V12
.
(b)
Quantification of the number of lamellocytes per one larva in each genotype.
Hml
Δ
-Gal4, UAS-EGFP/+
and
Hml
Δ
-Gal4, UAS-EGFP; UAS-Ras
V12
.
(c)
Real-time ATP rate assay (OCR) using hemocytes in
Hml
Δ
-Gal4, UAS-EGFP/+
(blue) and
Hml
Δ
-Gal4, UAS-EGFP; UAS-Ras
V12
(red).
(d)
Real-time ATP rate assay (ECAR) using hemocytes in
Hml
Δ
-Gal4, UAS-EGFP/+
(blue) and
Hml
Δ
-Gal4, UAS-EGFP; UAS-Ras
V12
(red).
(e)
Real-time ATP rate assay (OCR) using hemocytes in
Hml
Δ
-Gal4, UAS-EGFP/+
(blue) and
Hml
Δ
-Gal4, UAS-EGFP; UAS-hid,rpr
(red).
(f)
Real-time ATP rate assay (ECAR) using hemocytes in
Hml
Δ
-Gal4, UAS-EGFP/+
(blue) and
Hml
Δ
-Gal4, UAS-EGFP; UAS-hid,rpr
(red).
(g)
Quantification of the number of crystal cells per imaging area (a square imaging area of 638.9 µm × 638.9 µm) in each genotype.
Hml
Δ
-Gal4, UAS-EGFP/+
(left) and
Hml
Δ
-Gal4, UAS-N
ICD
(right). Each dot represents the average of four imaging spots from one larva.
(h)
ATP production rate of wildtype (
Hml
Δ
-Gal4, UAS-EGFP/+
) or
N
ICD
-expressing hemocytes (
Hml
Δ
-Gal4, UAS-N
ICD
).
(i)
ATP-linked respiration levels of wildtype (
Hml
Δ
-Gal4, UAS-EGFP/+
) or
N
ICD
-expressing hemocytes (
Hml
Δ
-Gal4, UAS-N
ICD
).
(j)
Proton leak levels of wildtype (
Hml
Δ
-Gal4, UAS-EGFP/+
) or
N
ICD
-expressing hemocytes (
Hml
Δ
-Gal4, UAS-N
ICD
).
(k)
Mito stress test measuring OCR levels of wild type (
Hml
Δ
-Gal4, UAS-EGFP/+
; blue) or
N
ICD
-expressing hemocytes (
Hml
Δ
-Gal4, UAS-N
ICD
; red). Due to the fragile nature of crystal cells, control incubation time was reduced. Oligomycin was injected after 3rd cycle; FCCP after 6th cycle; Rot/AA after 9th cycle. In
(c)
,
(d)
,
(e)
, and
(f)
, oligomycin was injected after 6th cycle measurement. Rot/AA were injected after 9th cycle measurement. In
(a)
,
(b)
, and
(g)-(j)
statistical analysis was performed using unpaired t-test. n.s: not significant (p > 0.05). *p < 0.05; **p < 0.01; ***p < 0.001. Bars in graphs: the mean. Error bars: standard deviation.
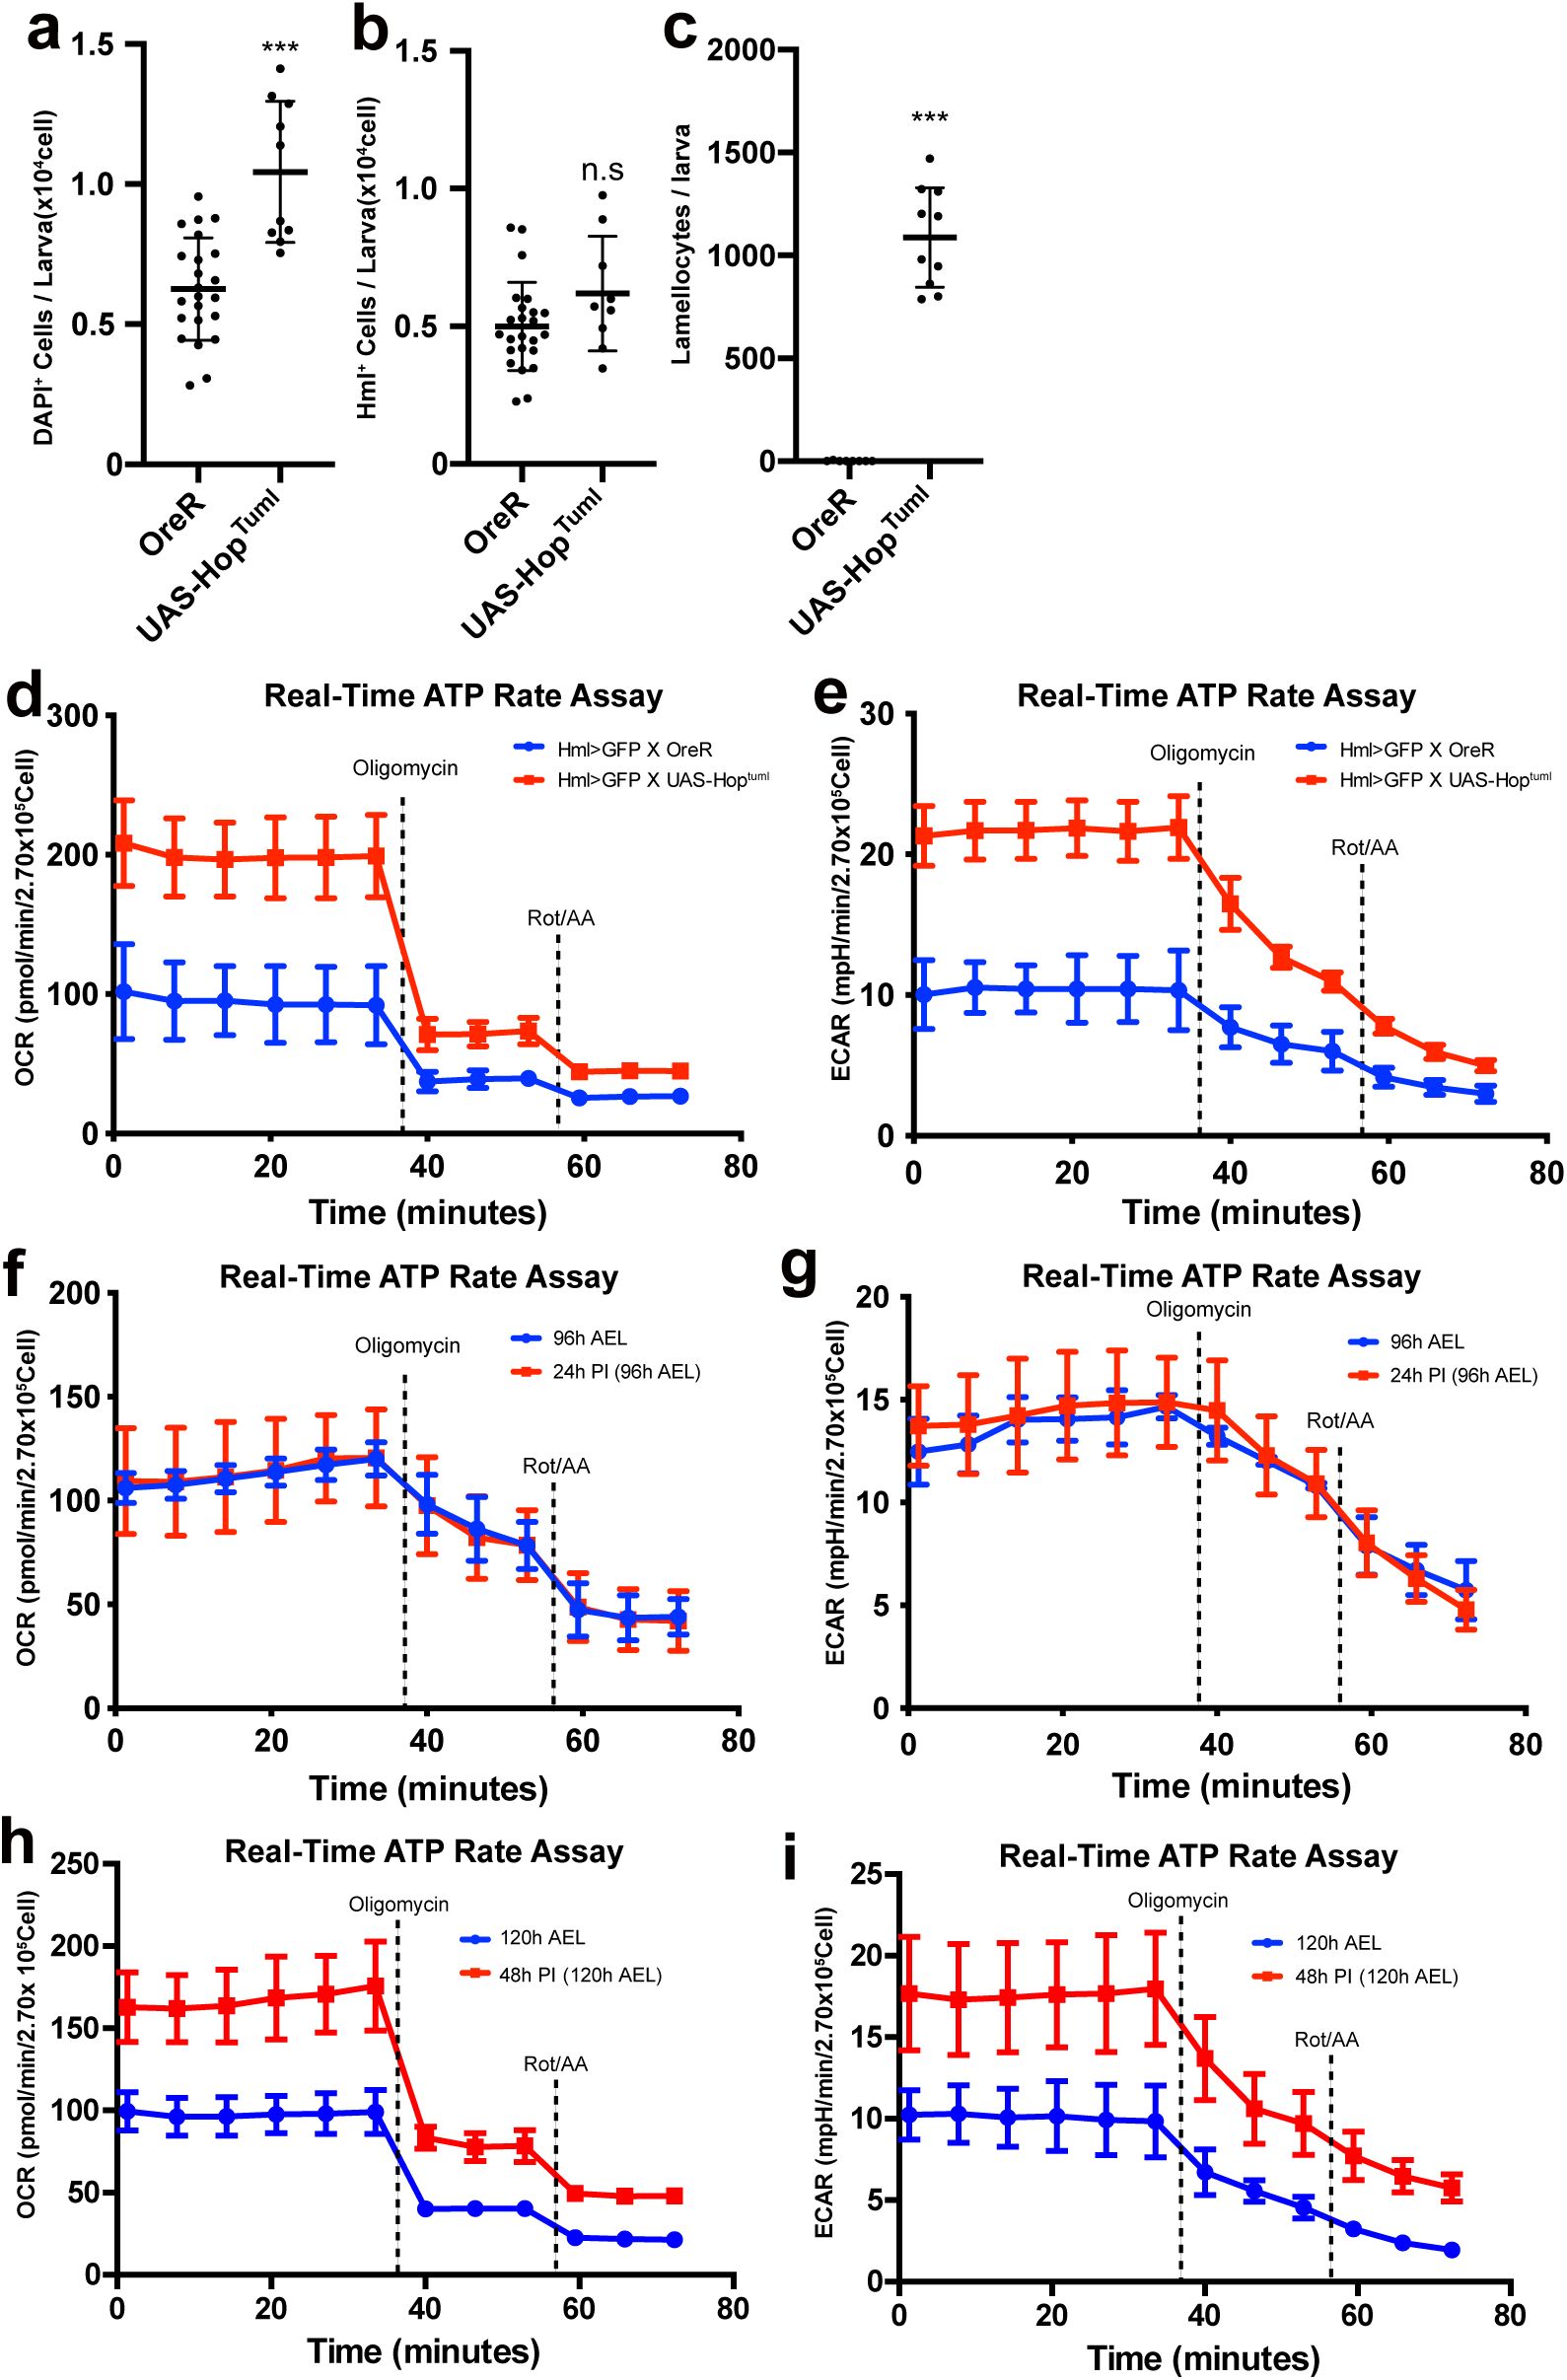
Metabolic measurement of larval hemocytes upon immune activation.
(a)
Quantification of DAPI-positive embryonic hemocytes in
Hml
Δ
-Gal4, UAS-EGFP/+
and
Hml
Δ
-Gal4, UAS-EGFP; UAS-Hop
Tuml
.
(b)
Quantification of Hml-positive embryonic hemocytes
Hml
Δ
-Gal4, UAS-EGFP/+
and
Hml
Δ
-Gal4, UAS-EGFP; UAS-Hop
Tuml
.
(c)
Quantification of lamellocytes among embryonic hemocyte in
Hml
Δ
-Gal4, UAS-EGFP/+
and
Hml
Δ
-Gal4, UAS-EGFP; UAS-Hop
Tuml
.
(d)
Real-time ATP rate assay (OCR) using wild-type hemocytes (
Hml
Δ
-Gal4, UAS-EGFP/+
) or
Hop
Tuml
-expressing hemocytes (
Hml
Δ
-Gal4, UAS-EGFP; UAS-Hop
Tuml
).
(e)
Real-time ATP rate assay (ECAR) using wild-type hemocytes (
Hml
Δ
-Gal4, UAS-EGFP/+
) or
Hop
Tuml
-expressing hemocytes (
Hml
Δ
-Gal4, UAS-EGFP; UAS-Hop
Tuml
).
(f)
Real-time ATP rate assay (OCR) using (
Hml
Δ
-Gal4, UAS-EGFP
) at 96 h AEL or 24 h post-infestation (24 h PI; equivalent to 96 h AEL).
(g)
Real-time ATP rate assay (ECAR) using (
Hml
Δ
-Gal4, UAS-EGFP
) at 96 h AEL or 24 h post-infestation (24 h PI; equivalent to 96 h AEL).
(h)
Real-time ATP rate assay (OCR) using (
Hml
Δ
-Gal4, UAS-EGFP
) at 120 h AEL or 48 h post-infestation (48 h PI; equivalent to 120 h AEL).
(i)
Real-time ATP rate assay (ECAR) using (
Hml
Δ
-Gal4, UAS-EGFP
) at 120 h AEL or 48 h post-infestation (48 h PI; equivalent to 120 h AEL). In
(d)
,
(e)
,
(f)
,
(g)
,
(h)
, and
(i)
, oligomycin was injected after 6th cycle measurement. Rot/AA were injected after 9th cycle measurement. In
(a)-(c)
, statistical analysis was performed using unpaired t-test. n.s: not significant (p > 0.05). *p < 0.05; **p < 0.01; ***p < 0.001. Bars in graphs: the mean. Error bars: standard deviation.
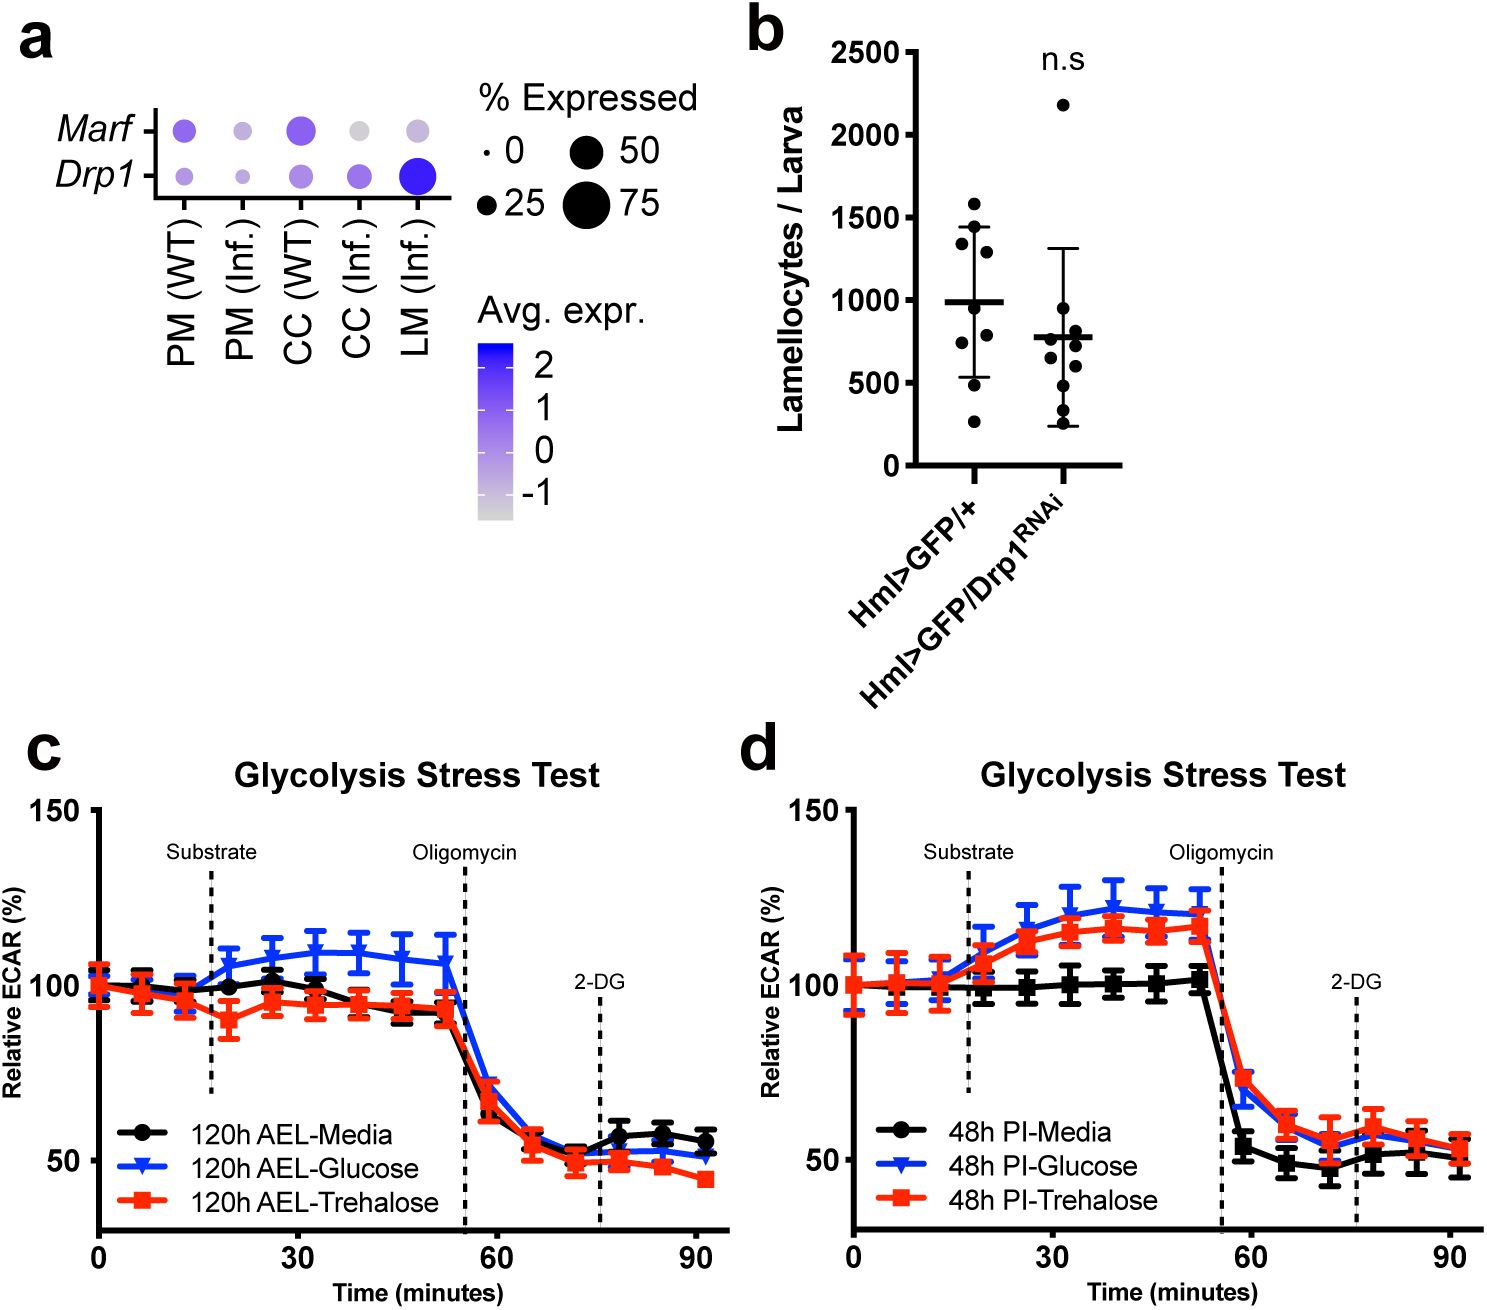
Metabolic modification in hemocytes upon wasp infestation.
(a)
Dot plot expression of
Marf
and
Drp1
across cell clusters. PM: plasmatocytes under conventional conditions, PM (inf.): plasmatocytes under wasp infestation, CC: crystal cells under conventional conditions, CC (inf.): crystal cells under wasp infestation, LM (inf.): lamellocytes under wasp infestation. Dot size represents the percentage of cells expressing each gene. Dot color shows average expression levels of each gene.
(b)
Quantification of lamellocytes among circulating hemocytes in
Hml
Δ
-Gal4 UAS-GFP/+
or
Hml
Δ
-Gal4 UAS-GFP UAS-Drp1 RNAi
at 48 h post-infestation (48 h PI; equivalent to 120 h AEL).
(c)
Seahorse XF glycolysis stress test using wild-type hemocytes. Glucose injection (blue) marginally increased ECAR, which was subsequently blocked by oligomycin. The final 2-DG injection did not alter ECAR in hemocytes. This phenotype was not recapitulated by trehalose (red) or the control group (black). Controls received assay medium lacking substrates at volumes matched to the substrate, oligomycin, or 2-DG injections.
(d)
Seahorse XF glycolysis stress test using hemocytes at 48 h post-infestation (PI). Both glucose (blue) and trehalose (red) marginally increased ECAR, which was subsequently blocked by oligomycin treatment. The final 2-DG injection did not change ECAR in hemocytes. Controls (black) received assay medium lacking substrates at volumes matched to the substrate, oligomycin, or 2-DG injections. In
(c)
and
(d)
, metabolic substrate was injected after 3rd cycle measurement. Oligomycin was injected after 9th cycle measurement. 2-DG was injected after 12th cycle measurement. In
(b)
, statistical analysis was performed using unpaired t-test. n.s: not significant (p > 0.05). Bars in graphs: the mean. Error bars: standard deviation.
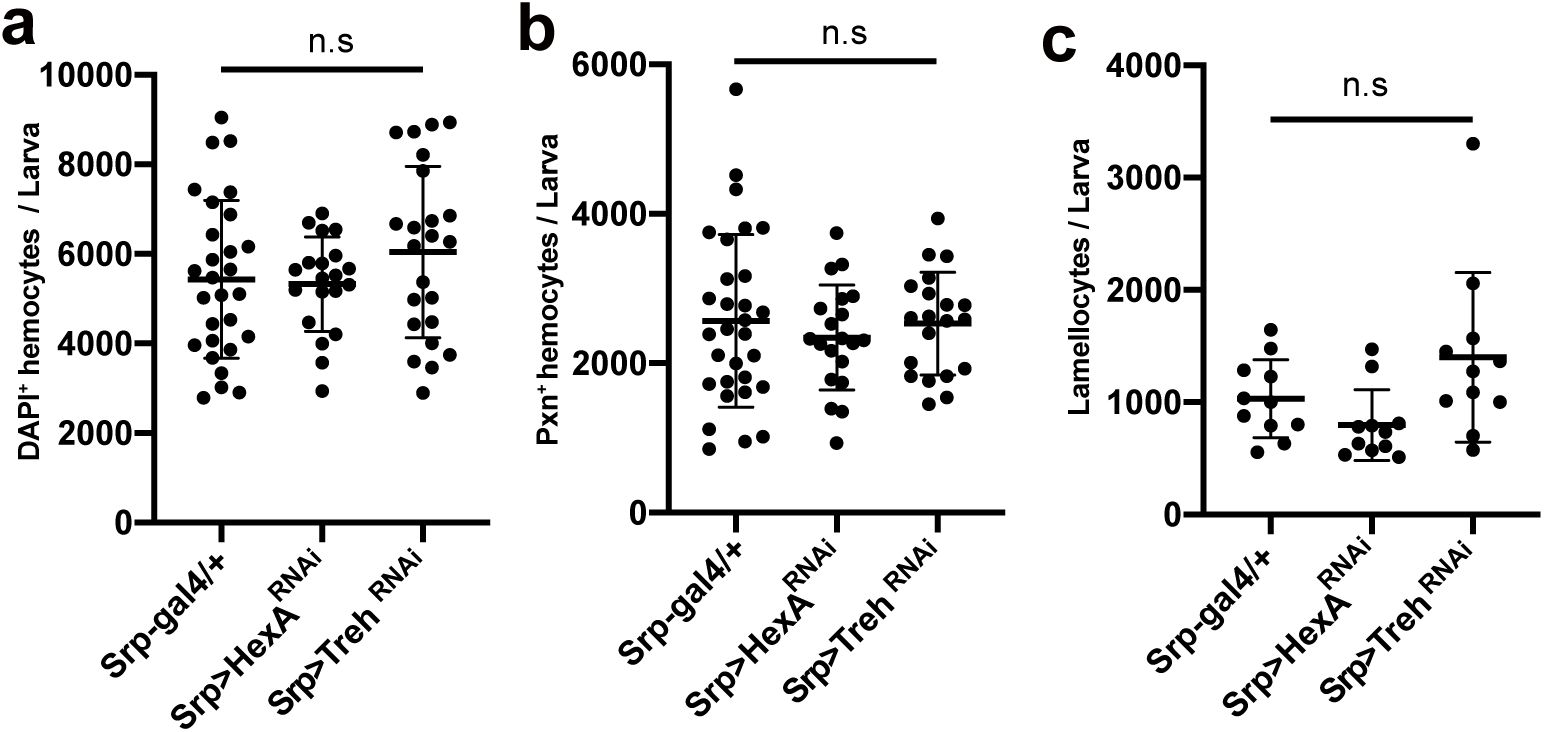
Knockdown of
hex-A
and
treh
shows no significant effect on hemocyte differentiation.
(a)
Quantification of DAPI-positive embryonic hemocytes in
Srp-Gal4/+
,
Srp-Gal4 UAS-Hex-A RNAi
, and
Srp-Gal4 UAS-Treh RNAi
at 48 h post-infestation (48 h PI; equivalent to 120 h AEL).
(b)
Quantification of Pxn-positive embryonic hemocytes in
Srp-Gal4/+
,
Srp-Gal4 UAS-Hex-A RNAi
, and
Srp-Gal4 UAS-Treh RNAi
at 48 h post-infestation (48 h PI; equivalent to 120 h AEL).
(c)
Quantification of lamellocytes among embryonic hemocyte in
Srp-Gal4/+
,
Srp-Gal4 UAS-Hex-A RNAi
, and
Srp-Gal4 UAS-Treh RNAi
at 48 h post-infestation (48 h PI; equivalent to 120 h AEL). In
(a)-(c)
, statistical analysis was performed using unpaired t-test. n.s: not significant (p > 0.05). *p < 0.05; **p < 0.01; ***p < 0.001. Bars in graphs: the mean. Error bars: standard deviation.
Data availability
All data generated during and/or analyzed during the current study are included in this published article and its supplementary files. In-house Python and R source codes used in this study are publicly available on GitHub repository (
). Analyses using public tools were performed using default parameters, otherwise, described in the Method section. All analyses were performed using Python (version 2.7.5), R (version 3.5.3), and R Studio (version 1.1.383). Detailed software versions are described in the Methods.
Acknowledgements
We thank all members of the Shim laboratory for their helpful comments. We thank Bloomington Drosophila Stock Center (NIH P40OD018537) and the Drosophila Genomics Resource Center (NIH 2P40OD010949), FlyBase (release 2025_04, 2019_03), and the Korean Drosophila Resource Center for supporting the fly community. This work was supported by Basic Science Research Program through the National Research Foundation of Korea (NRF) funded by the Ministry of Education (RS-2024-00349703 and RS-2025-02232977) and the New Faculty Startup Fund from Seoul National University to J.S.
Additional information
Author contributions
DL performed Seahorse analyses and wasp infestation analyses. FK and NC performed wasp infestation analyses and associated hemocyte counting. SHY, KTL, and JWN performed
in silico
analysis using hemocyte single cell RNA sequencing. DL, YVK, and JS designed this study and wrote the manuscript. YVK and JS supervised the project and conceived the idea.
Funding
National Research Foundation of Korea (NRF) (RS-2024-00349703)
Jiwon Shim
National Research Foundation of Korea (NRF) (RS-2025-02232977)
Jiwon Shim
References
1
Thicker than blood: conserved mechanisms in Drosophila and vertebrate hematopoiesis
Dev Cell
5
:673–690
https://doi.org/10.1016/s1534-5807(03)00335-6
Google Scholar
2
Drosophila as a Genetic Model for Hematopoiesis
Genetics
211
:367–417
PubMed
Google Scholar
3
Cell interactions in the differentiation of a melanotic tumor in Drosophila
Differentiation
12
:167–178
PubMed
Google Scholar
4
Drosophila hematopoiesis: Markers and methods for molecular genetic analysis
Methods
68
:242–251
PubMed
Google Scholar
5
A single-cell survey of Drosophila blood
eLife
9
PubMed
Google Scholar
6
Temporal specificity and heterogeneity of Drosophila immune cells
EMBO J
39
:e104486
PubMed
Google Scholar
7
Single-cell transcriptome maps of myeloid blood cell lineages in Drosophila
Nat Commun
11
:4483
PubMed
Google Scholar
8
Paths and pathways that generate cell-type heterogeneity and developmental progression in hematopoiesis
eLife
10
PubMed
Google Scholar
9
Molecular traces of Drosophila hemocytes reveal transcriptomic conservation with vertebrate myeloid cells
PLoS Genet
19
:e1011077
PubMed
Google Scholar
10
Embryonic origin of hemocytes and their relationship to cell death in Drosophila
Development
120
:1829–1837
PubMed
Google Scholar
11
Postembryonic hematopoiesis in Drosophila
Dev Biol
230
:243–257
PubMed
Google Scholar
12
Specification of Drosophila hematopoietic lineage by conserved transcription factors
Science
288
:146–149
PubMed
Google Scholar
13
Interaction between Notch and Hif-alpha in development and survival of Drosophila blood cells
Science
332
:1210–1213
PubMed
Google Scholar
14
Drosophila immune cells transport oxygen through PPO2 protein phase transition
Nature
631
:350–359
PubMed
Google Scholar
15
Lamellocyte differentiation in Drosophila larvae parasitized by Leptopilina
Dev Comp Immunol
16
:103–110
https://doi.org/10.1016/0145-305x(92)90011-z
PubMed
Google Scholar
16
Transdifferentiation and Proliferation in Two Distinct Hemocyte Lineages in Drosophila melanogaster Larvae after Wasp Infection
PLoS Pathog
12
:e1005746
PubMed
Google Scholar
17
Genetic analysis of contributions of dorsal group and JAK-Stat92E pathway genes to larval hemocyte concentration and the egg encapsulation response in Drosophila
Genetics
166
:1343–1356
PubMed
Google Scholar
18
Role of FGFR signaling in the morphogenesis of the Drosophila visceral musculature
Dev Dyn
231
:342–348
PubMed
Google Scholar
19
Ontogeny of the Drosophila larval hematopoietic organ, hemocyte homeostasis and the dedicated cellular immune response to parasitism
Int J Dev Biol
54
:1117–1125
PubMed
Google Scholar
20
RhoL controls invasion and Rap1 localization during immune cell transmigration in Drosophila
Nat Cell Biol
12
:605–610
PubMed
Google Scholar
21
Cell division in tissues enables macrophage infiltration
Science
376
:394–396
PubMed
Google Scholar
22
The peripheral nervous system supports blood cell homing and survival in the Drosophila larva
Development
138
:5379–5391
PubMed
Google Scholar
23
Drosophila as a model for the two myeloid blood cell systems in vertebrates
Exp Hematol
42
:717–727
PubMed
Google Scholar
24
The Drosophila lymph gland as a developmental model of hematopoiesis
Development
132
:2521–2533
PubMed
Google Scholar
25
Hematopoietic progenitors and hemocyte lineages in the Drosophila lymph gland
Dev Biol
346
:310–319
PubMed
Google Scholar
26
The convergence of Notch and MAPK signaling specifies the blood progenitor fate in the Drosophila mesoderm
Dev Biol
353
:105–118
PubMed
Google Scholar
27
Adult Drosophila Lack Hematopoiesis but Rely on a Blood Cell Reservoir at the Respiratory Epithelia to Relay Infection Signals to Surrounding Tissues
Dev Cell
51
:787–803
PubMed
Google Scholar
28
Immune-metabolic interaction in Drosophila
Fly
8
:75–79
PubMed
Google Scholar
29
Drosophila macrophages switch to aerobic glycolysis to mount effective antibacterial defense
eLife
8
PubMed
Google Scholar
30
Extracellular adenosine modulates host-pathogen interactions through regulation of systemic metabolism during immune response in Drosophila
PLoS Pathog
14
:e1007022
PubMed
Google Scholar
31
The adipokine NimrodB5 regulates peripheral hematopoiesis in Drosophila
Febs J
287
:3399–3426
PubMed
Google Scholar
32
Control of Drosophila blood cell activation via Toll signaling in the fat body
PLoS One
9
:e102568
PubMed
Google Scholar
33
Edin Expression in the Fat Body Is Required in the Defense Against Parasitic Wasps in Drosophila melanogaster
PLoS Pathog
11
:e1004895
PubMed
Google Scholar
34
Drosophila muscles regulate the immune response against wasp infection via carbohydrate metabolism
Sci Rep
7
:15713
PubMed
Google Scholar
35
JAK/STAT signaling in Drosophila muscles controls the cellular immune response against parasitoid infection
EMBO Rep
16
:1664–1672
PubMed
Google Scholar
36
Muscle function and homeostasis require cytokine inhibition of AKT activity in Drosophila
eLife
9
PubMed
Google Scholar
37
Innate Immune Signaling in Drosophila Blocks Insulin Signaling by Uncoupling PI(3,4,5)P(3) Production and Akt Activation
Cell Rep
22
:2550–2556
PubMed
Google Scholar
38
Toll-dependent antimicrobial responses in Drosophila larval fat body require Spatzle secreted by haemocytes
J Cell Sci
122
:4505–4515
PubMed
Google Scholar
39
Lime is a new protein linking immunity and metabolism in Drosophila
Dev Biol
452
:83–94
PubMed
Google Scholar
40
Extracellular flux assay (Seahorse assay): Diverse applications in metabolic research across biological disciplines
Mol Cells
47
:100095
PubMed
Google Scholar
41
Drosophila TRIM32 cooperates with glycolytic enzymes to promote cell growth
eLife
9
PubMed
Google Scholar
42
Rapid and transient oxygen consumption increase following acute HDAC/KDAC inhibition in Drosophila tissue
Sci Rep
8
:4199
PubMed
Google Scholar
43
Metabolic Analysis of Drosophila melanogaster Larval and Adult Brains
J Vis Exp
PubMed
Google Scholar
44
Oligomycin frames a common drug-binding site in the ATP synthase
Proc Natl Acad Sci U S A
109
:13961–13965
PubMed
Google Scholar
45
Mitochondrial complex I inhibitor rotenone induces apoptosis through enhancing mitochondrial reactive oxygen species production
J Biol Chem
278
:8516–8525
PubMed
Google Scholar
46
Mitochondrial electron transport chain complex III is required for antimycin A to inhibit autophagy
Chem Biol
18
:1474–1481
PubMed
Google Scholar
47
Differential toxic mechanisms of 2-deoxy-D-glucose versus 2-fluorodeoxy-D-glucose in hypoxic and normoxic tumor cells
Antioxid Redox Signal
9
:1383–1390
PubMed
Google Scholar
48
Bioenergetic analysis of intact mammalian cells using the Seahorse XF24 Extracellular Flux analyzer and a luciferase ATP assay
Methods Mol Biol
1105
:589–602
PubMed
Google Scholar
49
Assaying Blood Cell Populations of the Drosophila melanogaster Larva
J Vis Exp
PubMed
Google Scholar
50
Regulation of Drosophila hematopoietic sites by Activin-beta from active sensory neurons
Nat Commun
8
:15990
PubMed
Google Scholar
51
Subpopulation of Macrophage-Like Plasmatocytes Attenuates Systemic Growth via JAK/STAT in the Drosophila Fat Body
Front Immunol
11
:63
PubMed
Google Scholar
52
An amino acid substitution in the Drosophila hopTum-l Jak kinase causes leukemia-like hematopoietic defects
EMBO J
14
:1412–1420
PubMed
Google Scholar
53
Characterization of a lamellocyte transcriptional enhancer located within the misshapen gene of Drosophila melanogaster
PLoS One
4
:e6429
PubMed
Google Scholar
54
Cellular immune response to parasitization in Drosophila requires the EBF orthologue collier
PLoS Biol
2
:E196
PubMed
Google Scholar
55
Sessile hemocytes as a hematopoietic compartment in Drosophila melanogaster
Proc Natl Acad Sci U S A
106
:4805–4809
PubMed
Google Scholar
56
Bioenergetic role of mitochondrial fusion and fission
Biochim Biophys Acta
1817
:1833–1838
PubMed
Google Scholar
57
Flies without trehalose
J Biol Chem
290
:1244–1255
PubMed
Google Scholar
58
The immune response attenuates growth and nutrient storage in Drosophila by reducing insulin signaling
Proc Natl Acad Sci U S A
106
:20853–20858
PubMed
Google Scholar
59
Innate immune signaling in Drosophila shifts anabolic lipid metabolism from triglyceride storage to phospholipid synthesis to support immune function
PLoS Genet
16
:e1009192
PubMed
Google Scholar
60
Drosophila as a model to study obesity and metabolic disease
J Exp Biol
221
PubMed
Google Scholar
61
Extracellular adenosine mediates a systemic metabolic switch during immune response
PLoS Biol
13
:e1002135
PubMed
Google Scholar
62
The Metabolic Signature of Macrophage Responses
Front Immunol
10
:1462
PubMed
Google Scholar
63
Metabolic reprogramming of macrophages: glucose transporter 1 (GLUT1)-mediated glucose metabolism drives a proinflammatory phenotype
J Biol Chem
289
:7884–7896
PubMed
Google Scholar
64
Some biochemical aspects of the immune macrophage
Br J Exp Pathol
51
:97–105
PubMed
Google Scholar
65
Network integration of parallel metabolic and transcriptional data reveals metabolic modules that regulate macrophage polarization
Immunity
42
:419–430
PubMed
Google Scholar
66
Glucose and trehalose metabolism through the cyclic pentose phosphate pathway shapes pathogen resistance and host protection in Drosophila
PLoS Biol
22
:e3002299
PubMed
Google Scholar
67
Metabolic control of cellular immune-competency by odors in Drosophila
eLife
9
PubMed
Google Scholar
68
Blood progenitor redox homeostasis through olfaction-derived systemic GABA in hematopoietic growth control in Drosophila
Development
149
PubMed
Google Scholar
69
A high-sugar diet affects cellular and humoral immune responses in Drosophila
Exp Cell Res
368
:215–224
PubMed
Google Scholar
70
Drosophila sessile hemocyte clusters are true hematopoietic tissues that regulate larval blood cell differentiation
eLife
4
PubMed
Google Scholar
71
Brief guide to immunostaining
Mol Cells
48
:100157
PubMed
Google Scholar
72
Comprehensive Integration of Single-Cell Data
Cell
177
:1888–1902
PubMed
Google Scholar
73
Fast, sensitive and accurate integration of single-cell data with Harmony
Nat Methods
16
:1289–1296
PubMed
Google Scholar
Article and author information
Author information
Cite all versions
You can cite all versions using the DOI
10.7554/eLife.111341
. This DOI represents all versions, and will always resolve to the latest one.
Copyright
© 2026,
Lee et al.
This article is distributed under the terms of the
Creative Commons Attribution License
, which permits unrestricted use and redistribution provided that the original author and source are credited.
Metrics
views
0
downloads
0
citations
0
Views, downloads and citations are aggregated across all versions of this paper published by eLife.


